Immigrants from Malaysia vs Immigrants from Ukraine In Labor Force | Age 45-54
COMPARE
Immigrants from Malaysia
Immigrants from Ukraine
In Labor Force | Age 45-54
In Labor Force | Age 45-54 Comparison
Immigrants from Malaysia
Immigrants from Ukraine
83.2%
IN LABOR FORCE | AGE 45-54
91.4/ 100
METRIC RATING
116th/ 347
METRIC RANK
83.0%
IN LABOR FORCE | AGE 45-54
82.9/ 100
METRIC RATING
132nd/ 347
METRIC RANK
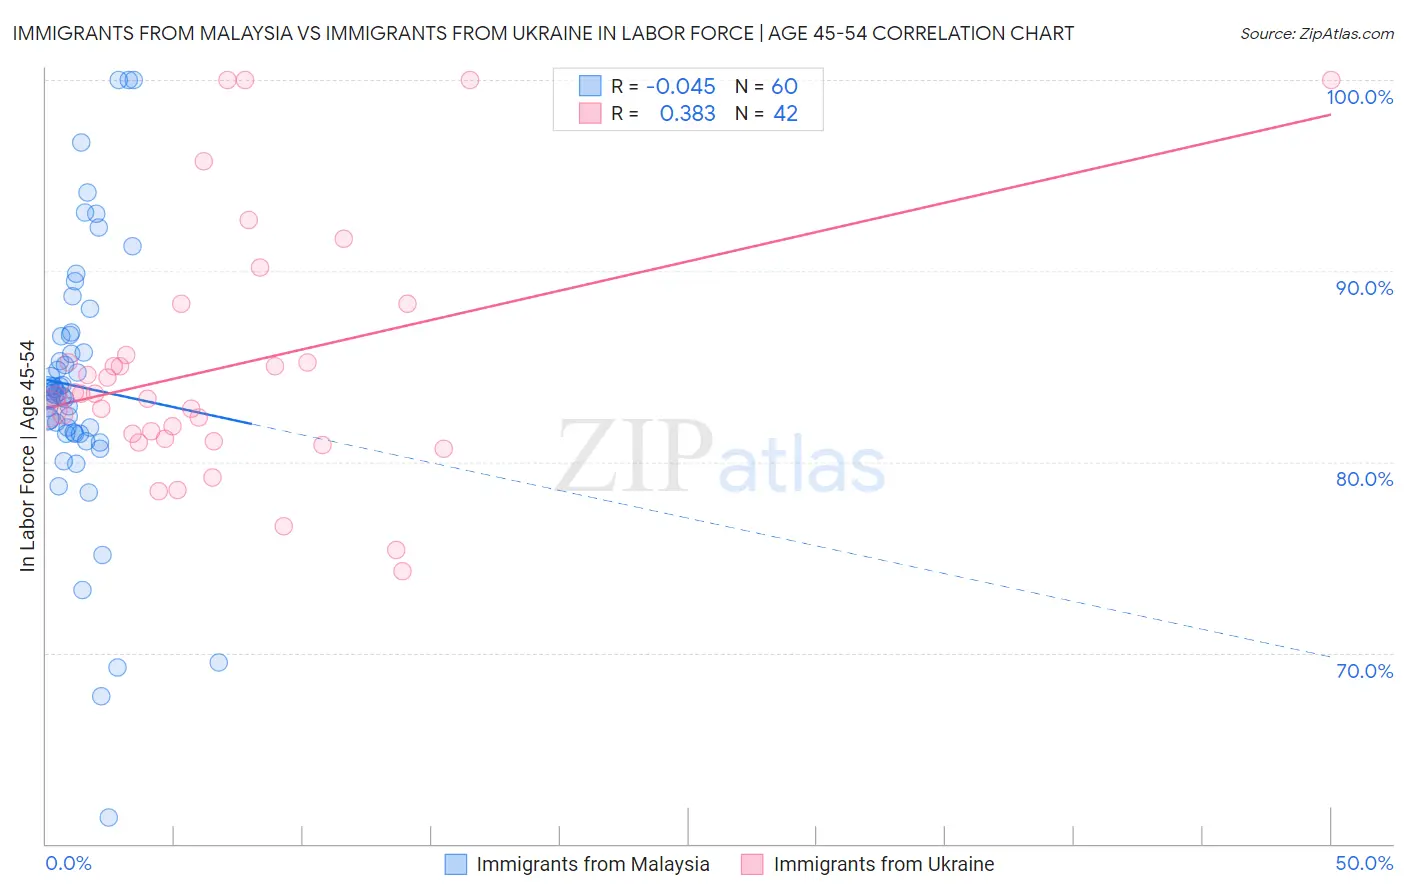
Immigrants from Malaysia vs Immigrants from Ukraine In Labor Force | Age 45-54 Correlation Chart
The statistical analysis conducted on geographies consisting of 197,919,693 people shows no correlation between the proportion of Immigrants from Malaysia and labor force participation rate among population between the ages 45 and 54 in the United States with a correlation coefficient (R) of -0.045 and weighted average of 83.2%. Similarly, the statistical analysis conducted on geographies consisting of 289,631,932 people shows a mild positive correlation between the proportion of Immigrants from Ukraine and labor force participation rate among population between the ages 45 and 54 in the United States with a correlation coefficient (R) of 0.383 and weighted average of 83.0%, a difference of 0.17%.
In Labor Force | Age 45-54 Correlation Summary
| Measurement | Immigrants from Malaysia | Immigrants from Ukraine |
| Minimum | 61.4% | 74.3% |
| Maximum | 100.0% | 100.0% |
| Range | 38.6% | 25.7% |
| Mean | 83.9% | 85.0% |
| Median | 83.6% | 83.5% |
| Interquartile 25% (IQ1) | 81.5% | 81.2% |
| Interquartile 75% (IQ3) | 86.6% | 85.6% |
| Interquartile Range (IQR) | 5.1% | 4.3% |
| Standard Deviation (Sample) | 7.2% | 6.5% |
| Standard Deviation (Population) | 7.1% | 6.4% |
Demographics Similar to Immigrants from Malaysia and Immigrants from Ukraine by In Labor Force | Age 45-54
In terms of in labor force | age 45-54, the demographic groups most similar to Immigrants from Malaysia are Immigrants from Chile (83.2%, a difference of 0.0%), Assyrian/Chaldean/Syriac (83.2%, a difference of 0.010%), Immigrants from China (83.2%, a difference of 0.010%), Immigrants from Europe (83.2%, a difference of 0.020%), and Immigrants from Uruguay (83.2%, a difference of 0.030%). Similarly, the demographic groups most similar to Immigrants from Ukraine are Liberian (83.0%, a difference of 0.0%), Finnish (83.1%, a difference of 0.010%), Sudanese (83.0%, a difference of 0.010%), Immigrants from Northern Europe (83.1%, a difference of 0.030%), and Immigrants from Israel (83.1%, a difference of 0.030%).
| Demographics | Rating | Rank | In Labor Force | Age 45-54 |
| Assyrians/Chaldeans/Syriacs | 91.7 /100 | #114 | Exceptional 83.2% |
| Immigrants | Chile | 91.6 /100 | #115 | Exceptional 83.2% |
| Immigrants | Malaysia | 91.4 /100 | #116 | Exceptional 83.2% |
| Immigrants | China | 90.9 /100 | #117 | Exceptional 83.2% |
| Immigrants | Europe | 90.7 /100 | #118 | Exceptional 83.2% |
| Immigrants | Uruguay | 90.2 /100 | #119 | Exceptional 83.2% |
| Immigrants | Russia | 90.1 /100 | #120 | Exceptional 83.2% |
| Uruguayans | 89.4 /100 | #121 | Excellent 83.1% |
| Immigrants | Vietnam | 88.9 /100 | #122 | Excellent 83.1% |
| Tongans | 88.2 /100 | #123 | Excellent 83.1% |
| Bermudans | 88.0 /100 | #124 | Excellent 83.1% |
| Immigrants | Iran | 87.2 /100 | #125 | Excellent 83.1% |
| Immigrants | Belgium | 86.4 /100 | #126 | Excellent 83.1% |
| Immigrants | Jordan | 85.2 /100 | #127 | Excellent 83.1% |
| Germans | 85.1 /100 | #128 | Excellent 83.1% |
| Immigrants | Northern Europe | 85.1 /100 | #129 | Excellent 83.1% |
| Immigrants | Israel | 84.7 /100 | #130 | Excellent 83.1% |
| Finns | 83.3 /100 | #131 | Excellent 83.1% |
| Immigrants | Ukraine | 82.9 /100 | #132 | Excellent 83.0% |
| Liberians | 82.7 /100 | #133 | Excellent 83.0% |
| Sudanese | 82.0 /100 | #134 | Excellent 83.0% |