Immigrants from Iran vs Immigrants from Malaysia In Labor Force | Age 25-29
COMPARE
Immigrants from Iran
Immigrants from Malaysia
In Labor Force | Age 25-29
In Labor Force | Age 25-29 Comparison
Immigrants from Iran
Immigrants from Malaysia
84.9%
IN LABOR FORCE | AGE 25-29
84.8/ 100
METRIC RATING
124th/ 347
METRIC RANK
85.0%
IN LABOR FORCE | AGE 25-29
90.4/ 100
METRIC RATING
114th/ 347
METRIC RANK
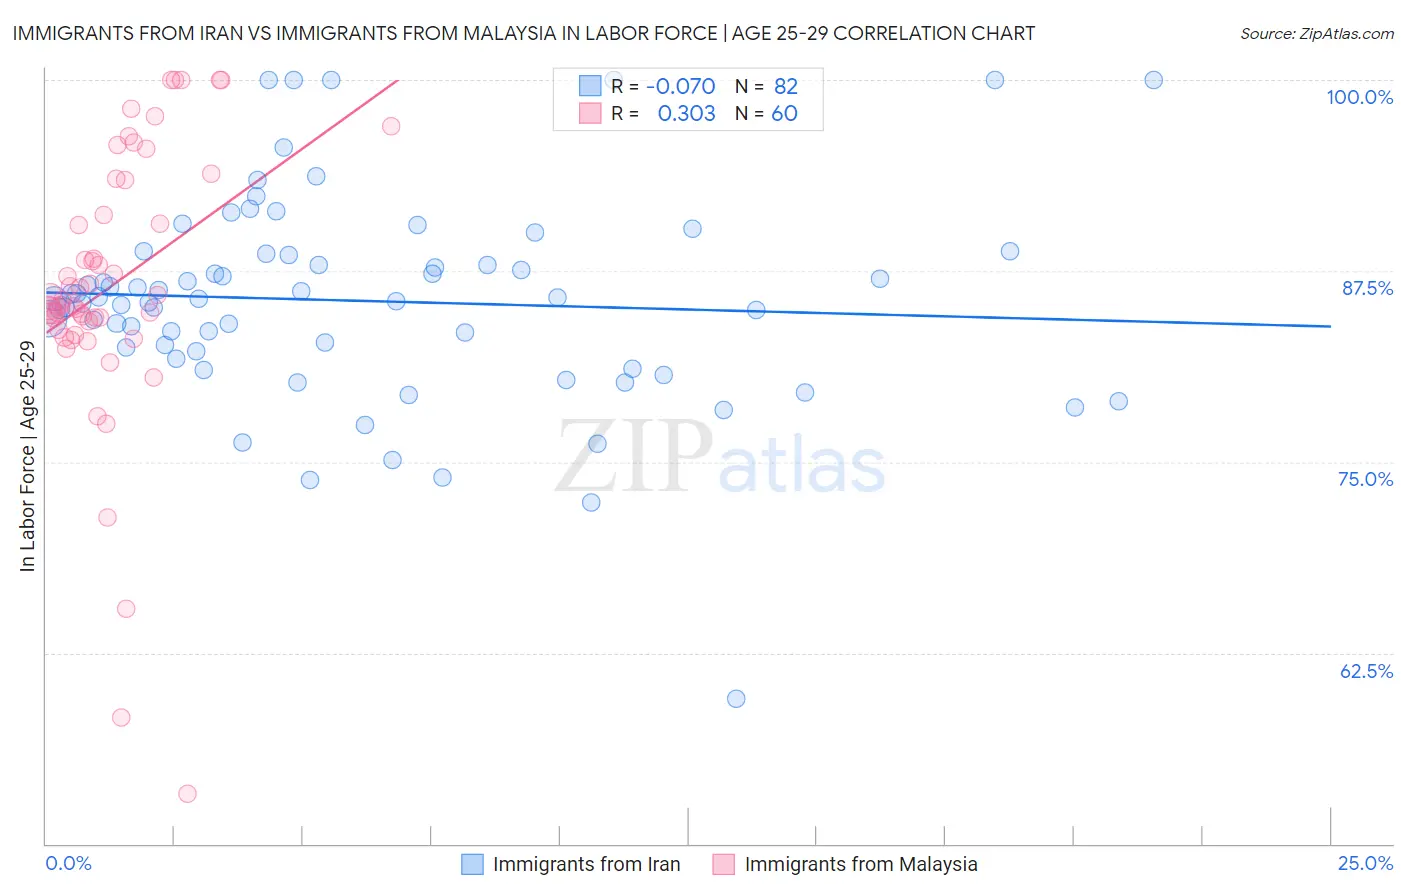
Immigrants from Iran vs Immigrants from Malaysia In Labor Force | Age 25-29 Correlation Chart
The statistical analysis conducted on geographies consisting of 279,858,438 people shows a slight negative correlation between the proportion of Immigrants from Iran and labor force participation rate among population between the ages 25 and 29 in the United States with a correlation coefficient (R) of -0.070 and weighted average of 84.9%. Similarly, the statistical analysis conducted on geographies consisting of 197,964,000 people shows a mild positive correlation between the proportion of Immigrants from Malaysia and labor force participation rate among population between the ages 25 and 29 in the United States with a correlation coefficient (R) of 0.303 and weighted average of 85.0%, a difference of 0.10%.
In Labor Force | Age 25-29 Correlation Summary
| Measurement | Immigrants from Iran | Immigrants from Malaysia |
| Minimum | 59.5% | 53.3% |
| Maximum | 100.0% | 100.0% |
| Range | 40.5% | 46.7% |
| Mean | 85.5% | 86.5% |
| Median | 85.7% | 85.4% |
| Interquartile 25% (IQ1) | 82.3% | 83.9% |
| Interquartile 75% (IQ3) | 88.6% | 92.3% |
| Interquartile Range (IQR) | 6.3% | 8.4% |
| Standard Deviation (Sample) | 6.8% | 9.0% |
| Standard Deviation (Population) | 6.7% | 8.9% |
Demographics Similar to Immigrants from Iran and Immigrants from Malaysia by In Labor Force | Age 25-29
In terms of in labor force | age 25-29, the demographic groups most similar to Immigrants from Iran are Scandinavian (84.9%, a difference of 0.0%), Dutch (84.9%, a difference of 0.0%), Uruguayan (84.9%, a difference of 0.0%), Immigrants from Chile (84.9%, a difference of 0.010%), and Immigrants from Singapore (84.9%, a difference of 0.010%). Similarly, the demographic groups most similar to Immigrants from Malaysia are Senegalese (85.0%, a difference of 0.010%), Irish (85.0%, a difference of 0.010%), Immigrants from Middle Africa (85.0%, a difference of 0.020%), Costa Rican (85.0%, a difference of 0.030%), and New Zealander (85.0%, a difference of 0.030%).
| Demographics | Rating | Rank | In Labor Force | Age 25-29 |
| Costa Ricans | 91.9 /100 | #109 | Exceptional 85.0% |
| New Zealanders | 91.5 /100 | #110 | Exceptional 85.0% |
| Immigrants | Middle Africa | 91.4 /100 | #111 | Exceptional 85.0% |
| Senegalese | 90.9 /100 | #112 | Exceptional 85.0% |
| Irish | 90.6 /100 | #113 | Exceptional 85.0% |
| Immigrants | Malaysia | 90.4 /100 | #114 | Exceptional 85.0% |
| South Africans | 88.9 /100 | #115 | Excellent 85.0% |
| Chileans | 88.8 /100 | #116 | Excellent 85.0% |
| Immigrants | Belarus | 88.0 /100 | #117 | Excellent 85.0% |
| Finns | 87.8 /100 | #118 | Excellent 85.0% |
| Filipinos | 87.1 /100 | #119 | Excellent 84.9% |
| Immigrants | South Africa | 86.1 /100 | #120 | Excellent 84.9% |
| Immigrants | Chile | 85.6 /100 | #121 | Excellent 84.9% |
| Scandinavians | 85.1 /100 | #122 | Excellent 84.9% |
| Dutch | 84.9 /100 | #123 | Excellent 84.9% |
| Immigrants | Iran | 84.8 /100 | #124 | Excellent 84.9% |
| Uruguayans | 84.7 /100 | #125 | Excellent 84.9% |
| Immigrants | Singapore | 84.4 /100 | #126 | Excellent 84.9% |
| Immigrants | Uruguay | 84.0 /100 | #127 | Excellent 84.9% |
| Australians | 83.6 /100 | #128 | Excellent 84.9% |
| Immigrants | Russia | 81.6 /100 | #129 | Excellent 84.9% |