Immigrants from India vs Immigrants from Syria In Labor Force | Age 35-44
COMPARE
Immigrants from India
Immigrants from Syria
In Labor Force | Age 35-44
In Labor Force | Age 35-44 Comparison
Immigrants from India
Immigrants from Syria
85.3%
IN LABOR FORCE | AGE 35-44
99.9/ 100
METRIC RATING
32nd/ 347
METRIC RANK
83.9%
IN LABOR FORCE | AGE 35-44
2.5/ 100
METRIC RATING
235th/ 347
METRIC RANK
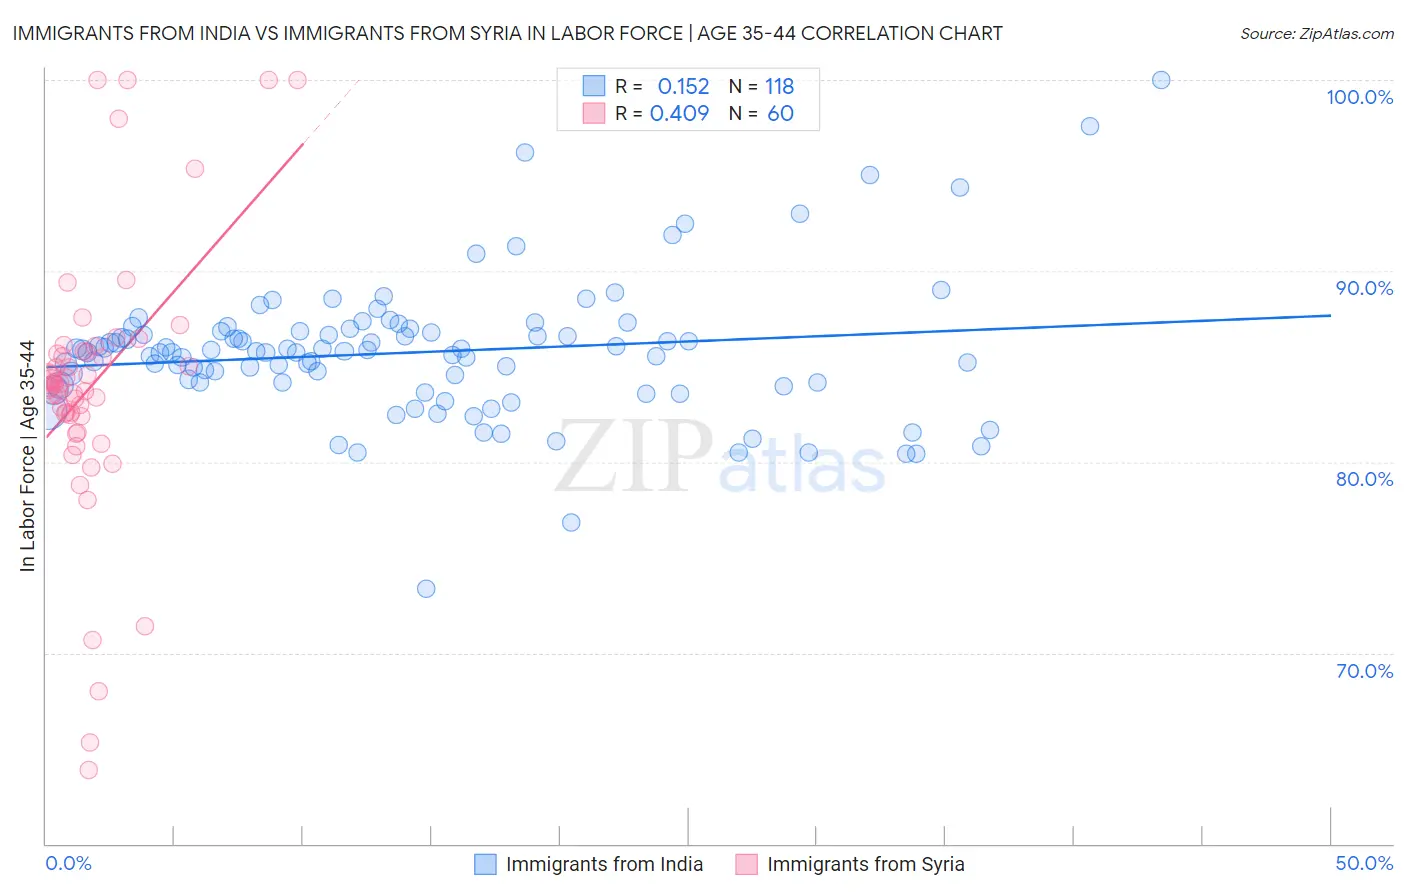
Immigrants from India vs Immigrants from Syria In Labor Force | Age 35-44 Correlation Chart
The statistical analysis conducted on geographies consisting of 433,829,652 people shows a poor positive correlation between the proportion of Immigrants from India and labor force participation rate among population between the ages 35 and 44 in the United States with a correlation coefficient (R) of 0.152 and weighted average of 85.3%. Similarly, the statistical analysis conducted on geographies consisting of 174,102,853 people shows a moderate positive correlation between the proportion of Immigrants from Syria and labor force participation rate among population between the ages 35 and 44 in the United States with a correlation coefficient (R) of 0.409 and weighted average of 83.9%, a difference of 1.7%.
In Labor Force | Age 35-44 Correlation Summary
| Measurement | Immigrants from India | Immigrants from Syria |
| Minimum | 73.3% | 63.8% |
| Maximum | 100.0% | 100.0% |
| Range | 26.7% | 36.2% |
| Mean | 85.7% | 84.0% |
| Median | 85.8% | 84.0% |
| Interquartile 25% (IQ1) | 84.1% | 82.4% |
| Interquartile 75% (IQ3) | 86.8% | 85.7% |
| Interquartile Range (IQR) | 2.7% | 3.3% |
| Standard Deviation (Sample) | 3.6% | 7.1% |
| Standard Deviation (Population) | 3.6% | 7.0% |
Similar Demographics by In Labor Force | Age 35-44
Demographics Similar to Immigrants from India by In Labor Force | Age 35-44
In terms of in labor force | age 35-44, the demographic groups most similar to Immigrants from India are Bermudan (85.3%, a difference of 0.0%), Czech (85.3%, a difference of 0.0%), Ugandan (85.3%, a difference of 0.010%), Cambodian (85.3%, a difference of 0.020%), and Immigrants from Nepal (85.3%, a difference of 0.030%).
| Demographics | Rating | Rank | In Labor Force | Age 35-44 |
| Paraguayans | 99.9 /100 | #25 | Exceptional 85.4% |
| Immigrants | Liberia | 99.9 /100 | #26 | Exceptional 85.4% |
| Immigrants | Lithuania | 99.9 /100 | #27 | Exceptional 85.4% |
| Immigrants | Greece | 99.9 /100 | #28 | Exceptional 85.3% |
| Cambodians | 99.9 /100 | #29 | Exceptional 85.3% |
| Bermudans | 99.9 /100 | #30 | Exceptional 85.3% |
| Czechs | 99.9 /100 | #31 | Exceptional 85.3% |
| Immigrants | India | 99.9 /100 | #32 | Exceptional 85.3% |
| Ugandans | 99.9 /100 | #33 | Exceptional 85.3% |
| Immigrants | Nepal | 99.9 /100 | #34 | Exceptional 85.3% |
| Estonians | 99.9 /100 | #35 | Exceptional 85.3% |
| Immigrants | Morocco | 99.8 /100 | #36 | Exceptional 85.2% |
| Kenyans | 99.8 /100 | #37 | Exceptional 85.2% |
| Immigrants | Poland | 99.8 /100 | #38 | Exceptional 85.2% |
| Eastern Europeans | 99.8 /100 | #39 | Exceptional 85.2% |
Demographics Similar to Immigrants from Syria by In Labor Force | Age 35-44
In terms of in labor force | age 35-44, the demographic groups most similar to Immigrants from Syria are West Indian (83.9%, a difference of 0.0%), Immigrants from Oceania (83.9%, a difference of 0.010%), Immigrants from Germany (83.9%, a difference of 0.020%), Native Hawaiian (83.9%, a difference of 0.030%), and Scottish (83.9%, a difference of 0.040%).
| Demographics | Rating | Rank | In Labor Force | Age 35-44 |
| Welsh | 5.3 /100 | #228 | Tragic 84.0% |
| Immigrants | Thailand | 4.7 /100 | #229 | Tragic 84.0% |
| Immigrants | Iraq | 3.7 /100 | #230 | Tragic 83.9% |
| Scottish | 3.2 /100 | #231 | Tragic 83.9% |
| Native Hawaiians | 3.0 /100 | #232 | Tragic 83.9% |
| Immigrants | Germany | 2.8 /100 | #233 | Tragic 83.9% |
| Immigrants | Oceania | 2.6 /100 | #234 | Tragic 83.9% |
| Immigrants | Syria | 2.5 /100 | #235 | Tragic 83.9% |
| West Indians | 2.4 /100 | #236 | Tragic 83.9% |
| English | 1.8 /100 | #237 | Tragic 83.8% |
| Immigrants | Laos | 1.7 /100 | #238 | Tragic 83.8% |
| Celtics | 1.4 /100 | #239 | Tragic 83.8% |
| Arabs | 1.3 /100 | #240 | Tragic 83.8% |
| Iraqis | 1.3 /100 | #241 | Tragic 83.8% |
| Immigrants | Cambodia | 1.1 /100 | #242 | Tragic 83.8% |