Immigrants from Eastern Africa vs Mexican American Indian In Labor Force | Age > 16

COMPARE

Immigrants from Eastern Africa
Race
Ancestry
AfghanAfricanAlaska NativeAlaskan AthabascanAlbanianAleutAlsatianAmericanApacheArabArapahoArgentineanArmenianAssyrian/Chaldean/SyriacAustralianAustrianBahamianBangladeshiBarbadianBasqueBelgianBelizeanBermudanBhutaneseBlackfeetBolivianBrazilianBritishBritish West IndianBulgarianBurmeseCajunCambodianCanadianCape VerdeanCarpatho RusynCelticCentral AmericanCentral American IndianCherokeeCheyenneChickasawChileanChineseChippewaChoctawColombianColvilleComancheCosta RicanCreeCreekCroatianCrowCubanCypriotCzechCzechoslovakianDanishDelawareDominicanDutchDutch West IndianEastern EuropeanEcuadorianEgyptianEnglishEstonianEthiopianEuropeanFijianFilipinoFinnishFrenchFrench American IndianFrench CanadianGermanGerman RussianGhanaianGreekGuamanian/ChamorroGuatemalanGuyaneseHaitianHmongHonduranHopiHoumaHungarianIcelanderIndian (Asian)IndonesianInupiatIranianIraqiIrishIroquoisIsraeliItalianJamaicanJapaneseJordanianKenyanKiowaKoreanLaotianLatvianLebaneseLiberianLithuanianLumbeeLuxembourgerMacedonianMalaysianMalteseMarshalleseMenomineeMexicanMongolianMoroccanNative HawaiianNavajoNepaleseNew ZealanderNicaraguanNigerianNorthern EuropeanNorwegianOkinawanOsageOttawaPaiutePakistaniPalestinianPanamanianParaguayanPennsylvania GermanPeruvianPimaPolishPortuguesePotawatomiPuebloPuerto RicanPuget Sound SalishRomanianRussianSalvadoranSamoanScandinavianScotch-IrishScottishSeminoleSenegaleseSerbianShoshoneSierra LeoneanSiouxSlavicSlovakSloveneSomaliSouth AfricanSouth AmericanSouth American IndianSoviet UnionSpaniardSpanishSpanish AmericanSpanish American IndianSri LankanSubsaharan AfricanSudaneseSwedishSwissSyrianTaiwaneseThaiTlingit-HaidaTohono O'OdhamTonganTrinidadian and TobagonianTsimshianTurkishU.S. Virgin IslanderUgandanUkrainianUruguayanUteVenezuelanVietnameseWelshWest IndianYakamaYaquiYugoslavianYumanYup'ikZimbabwean
Immigration
NonimmigrantsImmigrantsAfghanistanAfricaAlbaniaArgentinaArmeniaAsiaAustraliaAustriaBahamasBangladeshBarbadosBelarusBelgiumBelizeBoliviaBosnia and HerzegovinaBrazilBulgariaBurma/MyanmarCabo VerdeCambodiaCameroonCanadaCaribbeanCentral AmericaChileChinaColombiaCongoCosta RicaCroatiaCubaCzechoslovakiaDenmarkDominicaDominican RepublicEastern AfricaEastern AsiaEastern EuropeEcuadorEgyptEl SalvadorEnglandEritreaEthiopiaEuropeFijiFranceGermanyGhanaGreeceGrenadaGuatemalaGuyanaHaitiHondurasHong KongHungaryIndiaIndonesiaIranIraqIrelandIsraelItalyJamaicaJapanJordanKazakhstanKenyaKoreaKuwaitLaosLatin AmericaLatviaLebanonLiberiaLithuaniaMalaysiaMexicoMicronesiaMiddle AfricaMoldovaMoroccoNepalNetherlandsNicaraguaNigeriaNorth AmericaNorth MacedoniaNorthern AfricaNorthern EuropeNorwayOceaniaPakistanPanamaPeruPhilippinesPolandPortugalRomaniaRussiaSaudi ArabiaScotlandSenegalSerbiaSierra LeoneSingaporeSomaliaSouth AfricaSouth AmericaSouth Central AsiaSouth Eastern AsiaSouthern EuropeSpainSri LankaSt. Vincent and the GrenadinesSudanSwedenSwitzerlandSyriaTaiwanThailandTrinidad and TobagoTurkeyUgandaUkraineUruguayUzbekistanVenezuelaVietnamWest IndiesWestern AfricaWestern AsiaWestern EuropeYemenZaireZimbabweAzores
Mexican American Indian
Race
Ancestry
AfghanAfricanAlaska NativeAlaskan AthabascanAlbanianAleutAlsatianAmericanApacheArabArapahoArgentineanArmenianAssyrian/Chaldean/SyriacAustralianAustrianBahamianBangladeshiBarbadianBasqueBelgianBelizeanBermudanBhutaneseBlackfeetBolivianBrazilianBritishBritish West IndianBulgarianBurmeseCajunCambodianCanadianCape VerdeanCarpatho RusynCelticCentral AmericanCentral American IndianCherokeeCheyenneChickasawChileanChineseChippewaChoctawColombianColvilleComancheCosta RicanCreeCreekCroatianCrowCubanCypriotCzechCzechoslovakianDanishDelawareDominicanDutchDutch West IndianEastern EuropeanEcuadorianEgyptianEnglishEstonianEthiopianEuropeanFijianFilipinoFinnishFrenchFrench American IndianFrench CanadianGermanGerman RussianGhanaianGreekGuamanian/ChamorroGuatemalanGuyaneseHaitianHmongHonduranHopiHoumaHungarianIcelanderIndian (Asian)IndonesianInupiatIranianIraqiIrishIroquoisIsraeliItalianJamaicanJapaneseJordanianKenyanKiowaKoreanLaotianLatvianLebaneseLiberianLithuanianLumbeeLuxembourgerMacedonianMalaysianMalteseMarshalleseMenomineeMexicanMexican American IndianMongolianMoroccanNative HawaiianNavajoNepaleseNew ZealanderNicaraguanNigerianNorthern EuropeanNorwegianOkinawanOsageOttawaPaiutePakistaniPalestinianPanamanianParaguayanPennsylvania GermanPeruvianPimaPolishPortuguesePotawatomiPuebloPuerto RicanPuget Sound SalishRomanianRussianSalvadoranSamoanScandinavianScotch-IrishScottishSeminoleSenegaleseSerbianShoshoneSierra LeoneanSiouxSlavicSlovakSloveneSomaliSouth AfricanSouth AmericanSouth American IndianSoviet UnionSpaniardSpanishSpanish AmericanSpanish American IndianSri LankanSubsaharan AfricanSudaneseSwedishSwissSyrianTaiwaneseThaiTlingit-HaidaTohono O'OdhamTonganTrinidadian and TobagonianTsimshianTurkishU.S. Virgin IslanderUgandanUkrainianUruguayanUteVenezuelanVietnameseWelshWest IndianYakamaYaquiYugoslavianYumanYup'ikZimbabwean
Immigration
NonimmigrantsImmigrantsAfghanistanAfricaAlbaniaArgentinaArmeniaAsiaAustraliaAustriaBahamasBangladeshBarbadosBelarusBelgiumBelizeBoliviaBosnia and HerzegovinaBrazilBulgariaBurma/MyanmarCabo VerdeCambodiaCameroonCanadaCaribbeanCentral AmericaChileChinaColombiaCongoCosta RicaCroatiaCubaCzechoslovakiaDenmarkDominicaDominican RepublicEastern AsiaEastern EuropeEcuadorEgyptEl SalvadorEnglandEritreaEthiopiaEuropeFijiFranceGermanyGhanaGreeceGrenadaGuatemalaGuyanaHaitiHondurasHong KongHungaryIndiaIndonesiaIranIraqIrelandIsraelItalyJamaicaJapanJordanKazakhstanKenyaKoreaKuwaitLaosLatin AmericaLatviaLebanonLiberiaLithuaniaMalaysiaMexicoMicronesiaMiddle AfricaMoldovaMoroccoNepalNetherlandsNicaraguaNigeriaNorth AmericaNorth MacedoniaNorthern AfricaNorthern EuropeNorwayOceaniaPakistanPanamaPeruPhilippinesPolandPortugalRomaniaRussiaSaudi ArabiaScotlandSenegalSerbiaSierra LeoneSingaporeSomaliaSouth AfricaSouth AmericaSouth Central AsiaSouth Eastern AsiaSouthern EuropeSpainSri LankaSt. Vincent and the GrenadinesSudanSwedenSwitzerlandSyriaTaiwanThailandTrinidad and TobagoTurkeyUgandaUkraineUruguayUzbekistanVenezuelaVietnamWest IndiesWestern AfricaWestern AsiaWestern EuropeYemenZaireZimbabweAzores
In Labor Force | Age > 16
Income
Poverty
Unemployment
Labor Participation
Family Structure
Vehicle Availability
Education Level
Disability

In Labor Force | Age > 16 Comparison

Immigrants from Eastern Africa

Mexican American Indians

Exceptional
Fair
68.5%
IN LABOR FORCE | AGE > 16
100.0/ 100
METRIC RATING
9th/ 347
METRIC RANK
64.9%
IN LABOR FORCE | AGE > 16
23.1/ 100
METRIC RATING
199th/ 347
METRIC RANK

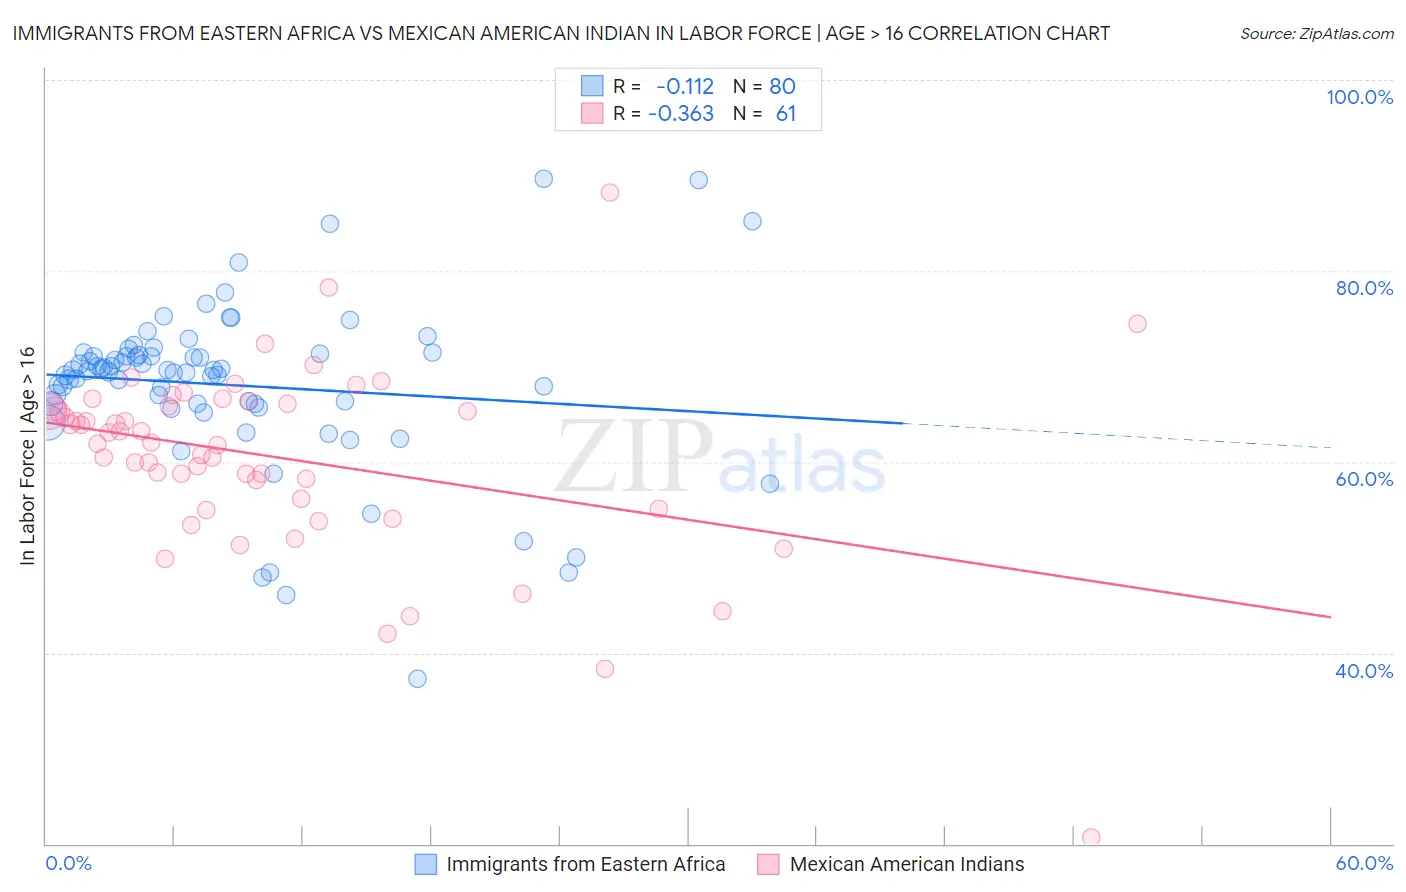
Immigrants from Eastern Africa vs Mexican American Indian In Labor Force | Age > 16 Correlation Chart

The statistical analysis conducted on geographies consisting of 355,171,869 people shows a poor negative correlation between the proportion of Immigrants from Eastern Africa and labor force participation rate among population ages 16 and over in the United States with a correlation coefficient (R) of -0.112 and weighted average of 68.5%. Similarly, the statistical analysis conducted on geographies consisting of 317,603,997 people shows a mild negative correlation between the proportion of Mexican American Indians and labor force participation rate among population ages 16 and over in the United States with a correlation coefficient (R) of -0.363 and weighted average of 64.9%, a difference of 5.5%.
Immigrants from Eastern Africa vs Mexican American Indian In Labor Force | Age > 16

In Labor Force | Age > 16 Correlation Summary

MeasurementImmigrants from Eastern AfricaMexican American Indian
Minimum37.3%20.7%
Maximum89.6%88.2%
Range52.3%67.5%
Mean68.0%60.5%
Median69.5%62.1%
Interquartile 25% (IQ1)66.0%55.6%
Interquartile 75% (IQ3)71.3%66.0%
Interquartile Range (IQR)5.2%10.3%
Standard Deviation (Sample)8.8%10.0%
Standard Deviation (Population)8.7%9.9%

Similar Demographics by In Labor Force | Age > 16

Demographics Similar to Immigrants from Eastern Africa by In Labor Force | Age > 16

In terms of in labor force | age > 16, the demographic groups most similar to Immigrants from Eastern Africa are Immigrants from Sierra Leone (68.5%, a difference of 0.010%), Immigrants from Bolivia (68.4%, a difference of 0.030%), Immigrants from Cameroon (68.7%, a difference of 0.33%), Bolivian (68.2%, a difference of 0.40%), and Immigrants from Eritrea (68.9%, a difference of 0.58%).
DemographicsRating | RankIn Labor Force | Age > 16
Ethiopians
100.0
/100
|
#2
Exceptional
69.3%
Somalis
100.0
/100
|
#3
Exceptional
69.2%
Immigrants | Somalia
100.0
/100
|
#4
Exceptional
69.1%
Sierra Leoneans
100.0
/100
|
#5
Exceptional
68.9%
Immigrants | Eritrea
100.0
/100
|
#6
Exceptional
68.9%
Immigrants | Cameroon
100.0
/100
|
#7
Exceptional
68.7%
Immigrants | Sierra Leone
100.0
/100
|
#8
Exceptional
68.5%
Immigrants | Eastern Africa
100.0
/100
|
#9
Exceptional
68.5%
Immigrants | Bolivia
100.0
/100
|
#10
Exceptional
68.4%
Bolivians
100.0
/100
|
#11
Exceptional
68.2%
Sudanese
100.0
/100
|
#12
Exceptional
68.0%
Immigrants | Nepal
100.0
/100
|
#13
Exceptional
68.0%
Liberians
100.0
/100
|
#14
Exceptional
67.8%
Immigrants | Middle Africa
100.0
/100
|
#15
Exceptional
67.7%
Immigrants | Sudan
100.0
/100
|
#16
Exceptional
67.7%

Demographics Similar to Mexican American Indians by In Labor Force | Age > 16

In terms of in labor force | age > 16, the demographic groups most similar to Mexican American Indians are Greek (64.9%, a difference of 0.050%), Armenian (64.9%, a difference of 0.050%), Ukrainian (64.9%, a difference of 0.060%), Immigrants from Belgium (64.9%, a difference of 0.060%), and Russian (64.9%, a difference of 0.070%).
DemographicsRating | RankIn Labor Force | Age > 16
Immigrants | Fiji
33.7
/100
|
#192
Fair
65.0%
Immigrants | Europe
33.6
/100
|
#193
Fair
65.0%
Immigrants | Southern Europe
31.3
/100
|
#194
Fair
65.0%
Romanians
31.1
/100
|
#195
Fair
65.0%
Haitians
30.6
/100
|
#196
Fair
65.0%
Immigrants | Italy
28.7
/100
|
#197
Fair
65.0%
Greeks
26.1
/100
|
#198
Fair
64.9%
Mexican American Indians
23.1
/100
|
#199
Fair
64.9%
Armenians
20.2
/100
|
#200
Fair
64.9%
Ukrainians
19.6
/100
|
#201
Poor
64.9%
Immigrants | Belgium
19.4
/100
|
#202
Poor
64.9%
Russians
18.8
/100
|
#203
Poor
64.9%
Slovenes
18.7
/100
|
#204
Poor
64.9%
Jamaicans
18.7
/100
|
#205
Poor
64.9%
Lithuanians
17.4
/100
|
#206
Poor
64.8%