Immigrants from Western Asia vs Barbadian In Labor Force | Age 30-34
COMPARE
Immigrants from Western Asia
Barbadian
In Labor Force | Age 30-34
In Labor Force | Age 30-34 Comparison
Immigrants from Western Asia
Barbadians
84.3%
IN LABOR FORCE | AGE 30-34
8.2/ 100
METRIC RATING
212th/ 347
METRIC RANK
84.6%
IN LABOR FORCE | AGE 30-34
36.7/ 100
METRIC RATING
182nd/ 347
METRIC RANK
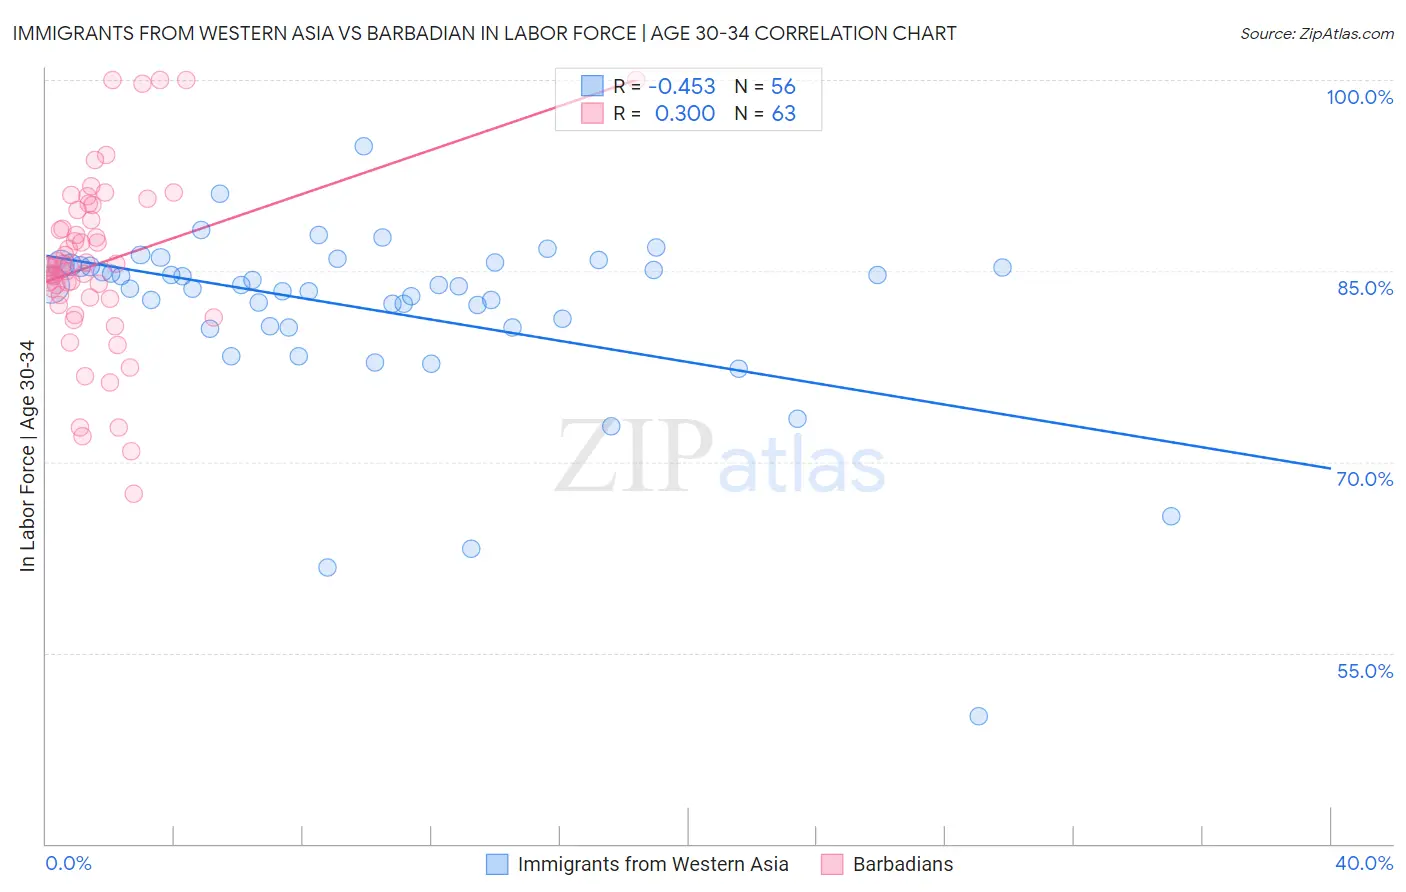
Immigrants from Western Asia vs Barbadian In Labor Force | Age 30-34 Correlation Chart
The statistical analysis conducted on geographies consisting of 404,180,460 people shows a moderate negative correlation between the proportion of Immigrants from Western Asia and labor force participation rate among population between the ages 30 and 34 in the United States with a correlation coefficient (R) of -0.453 and weighted average of 84.3%. Similarly, the statistical analysis conducted on geographies consisting of 141,265,054 people shows a weak positive correlation between the proportion of Barbadians and labor force participation rate among population between the ages 30 and 34 in the United States with a correlation coefficient (R) of 0.300 and weighted average of 84.6%, a difference of 0.33%.
In Labor Force | Age 30-34 Correlation Summary
| Measurement | Immigrants from Western Asia | Barbadian |
| Minimum | 50.0% | 67.5% |
| Maximum | 94.8% | 100.0% |
| Range | 44.8% | 32.5% |
| Mean | 81.9% | 85.6% |
| Median | 83.8% | 85.3% |
| Interquartile 25% (IQ1) | 80.6% | 82.8% |
| Interquartile 75% (IQ3) | 85.4% | 89.7% |
| Interquartile Range (IQR) | 4.8% | 6.9% |
| Standard Deviation (Sample) | 7.3% | 6.9% |
| Standard Deviation (Population) | 7.2% | 6.9% |
Similar Demographics by In Labor Force | Age 30-34
Demographics Similar to Immigrants from Western Asia by In Labor Force | Age 30-34
In terms of in labor force | age 30-34, the demographic groups most similar to Immigrants from Western Asia are Arab (84.3%, a difference of 0.010%), Jamaican (84.3%, a difference of 0.010%), Indonesian (84.3%, a difference of 0.010%), Japanese (84.3%, a difference of 0.010%), and Immigrants from Jamaica (84.3%, a difference of 0.010%).
| Demographics | Rating | Rank | In Labor Force | Age 30-34 |
| French | 13.8 /100 | #205 | Poor 84.4% |
| Lebanese | 10.6 /100 | #206 | Poor 84.4% |
| Bangladeshis | 9.4 /100 | #207 | Tragic 84.3% |
| Arabs | 8.9 /100 | #208 | Tragic 84.3% |
| Jamaicans | 8.8 /100 | #209 | Tragic 84.3% |
| Indonesians | 8.8 /100 | #210 | Tragic 84.3% |
| Japanese | 8.8 /100 | #211 | Tragic 84.3% |
| Immigrants | Western Asia | 8.2 /100 | #212 | Tragic 84.3% |
| Immigrants | Jamaica | 7.9 /100 | #213 | Tragic 84.3% |
| Immigrants | Germany | 7.2 /100 | #214 | Tragic 84.3% |
| Europeans | 7.2 /100 | #215 | Tragic 84.3% |
| Immigrants | Ecuador | 7.1 /100 | #216 | Tragic 84.3% |
| Immigrants | Trinidad and Tobago | 7.0 /100 | #217 | Tragic 84.3% |
| Immigrants | Panama | 6.3 /100 | #218 | Tragic 84.3% |
| Swiss | 5.8 /100 | #219 | Tragic 84.3% |
Demographics Similar to Barbadians by In Labor Force | Age 30-34
In terms of in labor force | age 30-34, the demographic groups most similar to Barbadians are Immigrants from Canada (84.6%, a difference of 0.010%), Moroccan (84.6%, a difference of 0.030%), Immigrants from North America (84.6%, a difference of 0.030%), Immigrants from Nigeria (84.6%, a difference of 0.040%), and Immigrants from Netherlands (84.6%, a difference of 0.040%).
| Demographics | Rating | Rank | In Labor Force | Age 30-34 |
| Immigrants | South America | 50.0 /100 | #175 | Average 84.7% |
| Immigrants | Uzbekistan | 49.1 /100 | #176 | Average 84.7% |
| Laotians | 46.9 /100 | #177 | Average 84.7% |
| Okinawans | 44.1 /100 | #178 | Average 84.6% |
| Immigrants | Nigeria | 42.5 /100 | #179 | Average 84.6% |
| Immigrants | Netherlands | 42.1 /100 | #180 | Average 84.6% |
| Moroccans | 40.3 /100 | #181 | Average 84.6% |
| Barbadians | 36.7 /100 | #182 | Fair 84.6% |
| Immigrants | Canada | 35.0 /100 | #183 | Fair 84.6% |
| Immigrants | North America | 33.3 /100 | #184 | Fair 84.6% |
| Immigrants | Philippines | 31.5 /100 | #185 | Fair 84.6% |
| Immigrants | Congo | 29.7 /100 | #186 | Fair 84.6% |
| Costa Ricans | 29.6 /100 | #187 | Fair 84.6% |
| Taiwanese | 29.4 /100 | #188 | Fair 84.6% |
| Nigerians | 28.9 /100 | #189 | Fair 84.5% |