Immigrants from Costa Rica vs Trinidadian and Tobagonian In Labor Force | Age 35-44
COMPARE
Immigrants from Costa Rica
Trinidadian and Tobagonian
In Labor Force | Age 35-44
In Labor Force | Age 35-44 Comparison
Immigrants from Costa Rica
Trinidadians and Tobagonians
84.2%
IN LABOR FORCE | AGE 35-44
19.5/ 100
METRIC RATING
206th/ 347
METRIC RANK
84.5%
IN LABOR FORCE | AGE 35-44
69.5/ 100
METRIC RATING
153rd/ 347
METRIC RANK
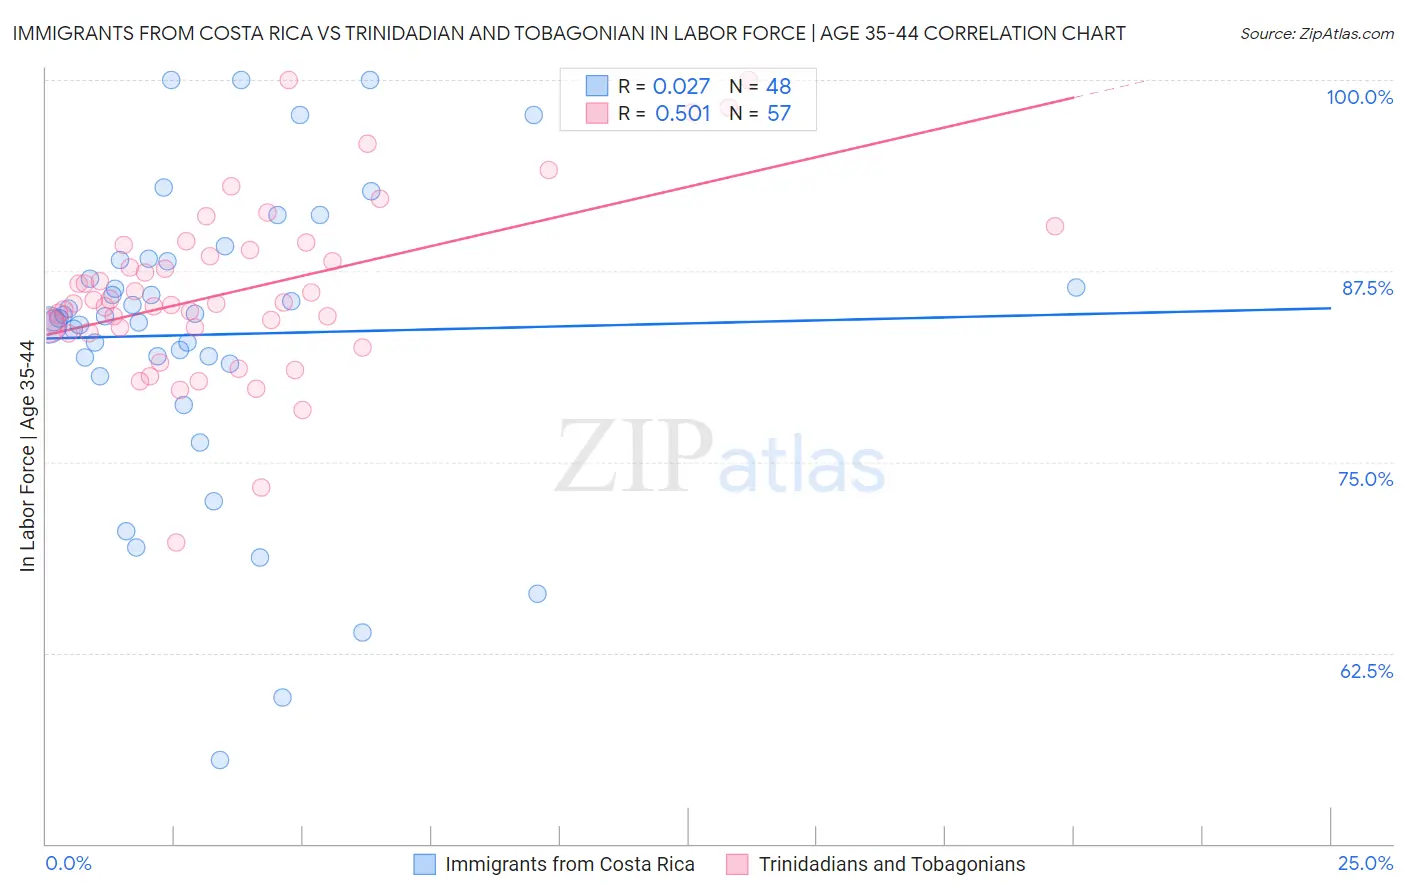
Immigrants from Costa Rica vs Trinidadian and Tobagonian In Labor Force | Age 35-44 Correlation Chart
The statistical analysis conducted on geographies consisting of 204,260,035 people shows no correlation between the proportion of Immigrants from Costa Rica and labor force participation rate among population between the ages 35 and 44 in the United States with a correlation coefficient (R) of 0.027 and weighted average of 84.2%. Similarly, the statistical analysis conducted on geographies consisting of 219,757,398 people shows a substantial positive correlation between the proportion of Trinidadians and Tobagonians and labor force participation rate among population between the ages 35 and 44 in the United States with a correlation coefficient (R) of 0.501 and weighted average of 84.5%, a difference of 0.36%.
In Labor Force | Age 35-44 Correlation Summary
| Measurement | Immigrants from Costa Rica | Trinidadian and Tobagonian |
| Minimum | 55.5% | 69.7% |
| Maximum | 100.0% | 100.0% |
| Range | 44.5% | 30.3% |
| Mean | 83.3% | 86.2% |
| Median | 84.5% | 85.4% |
| Interquartile 25% (IQ1) | 81.6% | 83.6% |
| Interquartile 75% (IQ3) | 88.2% | 89.0% |
| Interquartile Range (IQR) | 6.5% | 5.4% |
| Standard Deviation (Sample) | 9.8% | 5.7% |
| Standard Deviation (Population) | 9.7% | 5.7% |
Similar Demographics by In Labor Force | Age 35-44
Demographics Similar to Immigrants from Costa Rica by In Labor Force | Age 35-44
In terms of in labor force | age 35-44, the demographic groups most similar to Immigrants from Costa Rica are Canadian (84.2%, a difference of 0.0%), Immigrants from Canada (84.2%, a difference of 0.0%), Laotian (84.2%, a difference of 0.0%), Immigrants from North America (84.2%, a difference of 0.010%), and Swiss (84.2%, a difference of 0.020%).
| Demographics | Rating | Rank | In Labor Force | Age 35-44 |
| Syrians | 23.2 /100 | #199 | Fair 84.2% |
| Moroccans | 23.2 /100 | #200 | Fair 84.2% |
| British | 23.0 /100 | #201 | Fair 84.2% |
| Immigrants | Uzbekistan | 22.8 /100 | #202 | Fair 84.2% |
| Immigrants | South Eastern Asia | 22.4 /100 | #203 | Fair 84.2% |
| Canadians | 19.9 /100 | #204 | Poor 84.2% |
| Immigrants | Canada | 19.6 /100 | #205 | Poor 84.2% |
| Immigrants | Costa Rica | 19.5 /100 | #206 | Poor 84.2% |
| Laotians | 19.0 /100 | #207 | Poor 84.2% |
| Immigrants | North America | 18.1 /100 | #208 | Poor 84.2% |
| Swiss | 17.4 /100 | #209 | Poor 84.2% |
| New Zealanders | 16.2 /100 | #210 | Poor 84.1% |
| Immigrants | Ecuador | 15.2 /100 | #211 | Poor 84.1% |
| Israelis | 14.0 /100 | #212 | Poor 84.1% |
| Bangladeshis | 13.7 /100 | #213 | Poor 84.1% |
Demographics Similar to Trinidadians and Tobagonians by In Labor Force | Age 35-44
In terms of in labor force | age 35-44, the demographic groups most similar to Trinidadians and Tobagonians are Iranian (84.5%, a difference of 0.0%), Immigrants from Taiwan (84.5%, a difference of 0.010%), Romanian (84.5%, a difference of 0.020%), South American Indian (84.5%, a difference of 0.030%), and Okinawan (84.5%, a difference of 0.030%).
| Demographics | Rating | Rank | In Labor Force | Age 35-44 |
| Immigrants | Asia | 78.7 /100 | #146 | Good 84.5% |
| Immigrants | Netherlands | 76.6 /100 | #147 | Good 84.5% |
| South American Indians | 73.6 /100 | #148 | Good 84.5% |
| Okinawans | 73.5 /100 | #149 | Good 84.5% |
| Immigrants | Nigeria | 73.3 /100 | #150 | Good 84.5% |
| Romanians | 72.1 /100 | #151 | Good 84.5% |
| Immigrants | Taiwan | 71.4 /100 | #152 | Good 84.5% |
| Trinidadians and Tobagonians | 69.5 /100 | #153 | Good 84.5% |
| Iranians | 69.4 /100 | #154 | Good 84.5% |
| Immigrants | Switzerland | 65.9 /100 | #155 | Good 84.5% |
| Immigrants | Israel | 64.3 /100 | #156 | Good 84.4% |
| Immigrants | Austria | 63.8 /100 | #157 | Good 84.4% |
| Jamaicans | 62.7 /100 | #158 | Good 84.4% |
| Immigrants | Senegal | 60.4 /100 | #159 | Good 84.4% |
| Immigrants | Kazakhstan | 60.4 /100 | #160 | Good 84.4% |