Immigrants from Colombia vs Vietnamese In Labor Force | Age 25-29
COMPARE
Immigrants from Colombia
Vietnamese
In Labor Force | Age 25-29
In Labor Force | Age 25-29 Comparison
Immigrants from Colombia
Vietnamese
84.7%
IN LABOR FORCE | AGE 25-29
58.3/ 100
METRIC RATING
162nd/ 347
METRIC RANK
82.8%
IN LABOR FORCE | AGE 25-29
0.0/ 100
METRIC RATING
301st/ 347
METRIC RANK
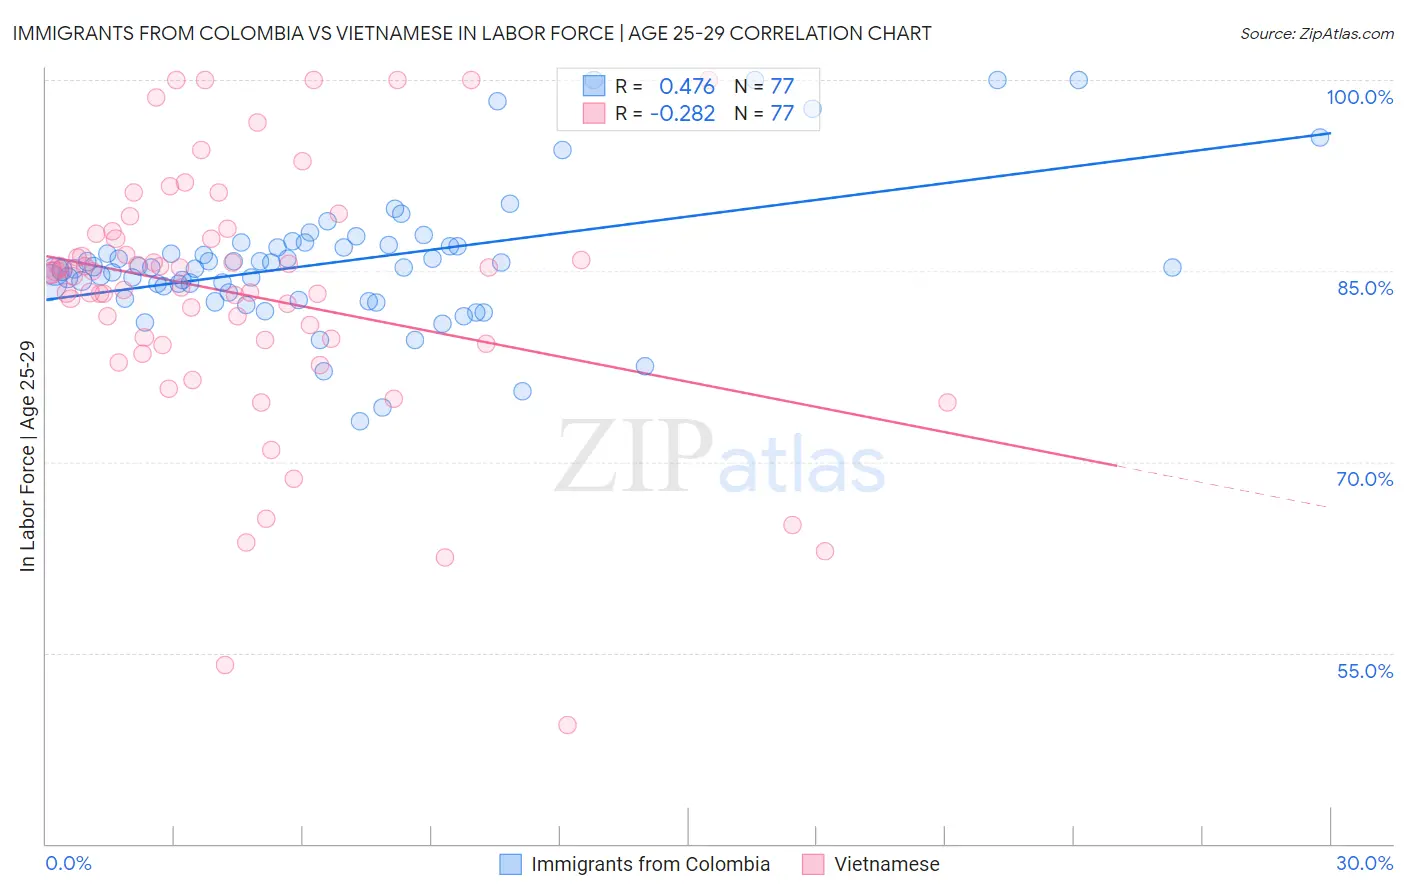
Immigrants from Colombia vs Vietnamese In Labor Force | Age 25-29 Correlation Chart
The statistical analysis conducted on geographies consisting of 378,572,642 people shows a moderate positive correlation between the proportion of Immigrants from Colombia and labor force participation rate among population between the ages 25 and 29 in the United States with a correlation coefficient (R) of 0.476 and weighted average of 84.7%. Similarly, the statistical analysis conducted on geographies consisting of 170,737,570 people shows a weak negative correlation between the proportion of Vietnamese and labor force participation rate among population between the ages 25 and 29 in the United States with a correlation coefficient (R) of -0.282 and weighted average of 82.8%, a difference of 2.2%.
In Labor Force | Age 25-29 Correlation Summary
| Measurement | Immigrants from Colombia | Vietnamese |
| Minimum | 73.2% | 49.3% |
| Maximum | 100.0% | 100.0% |
| Range | 26.8% | 50.7% |
| Mean | 85.8% | 83.1% |
| Median | 85.3% | 84.9% |
| Interquartile 25% (IQ1) | 83.1% | 79.4% |
| Interquartile 75% (IQ3) | 87.0% | 87.7% |
| Interquartile Range (IQR) | 3.9% | 8.3% |
| Standard Deviation (Sample) | 5.4% | 10.0% |
| Standard Deviation (Population) | 5.3% | 9.9% |
Similar Demographics by In Labor Force | Age 25-29
Demographics Similar to Immigrants from Colombia by In Labor Force | Age 25-29
In terms of in labor force | age 25-29, the demographic groups most similar to Immigrants from Colombia are Immigrants from Peru (84.7%, a difference of 0.0%), Canadian (84.7%, a difference of 0.0%), Argentinean (84.7%, a difference of 0.0%), Ghanaian (84.7%, a difference of 0.0%), and Immigrants from Ghana (84.7%, a difference of 0.010%).
| Demographics | Rating | Rank | In Labor Force | Age 25-29 |
| Indians (Asian) | 61.6 /100 | #155 | Good 84.7% |
| French | 61.0 /100 | #156 | Good 84.7% |
| British | 60.4 /100 | #157 | Good 84.7% |
| Immigrants | Ghana | 60.2 /100 | #158 | Good 84.7% |
| Immigrants | Western Africa | 60.1 /100 | #159 | Good 84.7% |
| Immigrants | Peru | 58.6 /100 | #160 | Average 84.7% |
| Canadians | 58.5 /100 | #161 | Average 84.7% |
| Immigrants | Colombia | 58.3 /100 | #162 | Average 84.7% |
| Argentineans | 57.9 /100 | #163 | Average 84.7% |
| Ghanaians | 57.6 /100 | #164 | Average 84.7% |
| Immigrants | Burma/Myanmar | 57.4 /100 | #165 | Average 84.7% |
| Immigrants | Spain | 56.9 /100 | #166 | Average 84.7% |
| Indonesians | 56.5 /100 | #167 | Average 84.7% |
| South Americans | 54.9 /100 | #168 | Average 84.7% |
| Celtics | 52.5 /100 | #169 | Average 84.7% |
Demographics Similar to Vietnamese by In Labor Force | Age 25-29
In terms of in labor force | age 25-29, the demographic groups most similar to Vietnamese are Immigrants from Belize (82.8%, a difference of 0.030%), Immigrants from Grenada (82.8%, a difference of 0.050%), Spanish American Indian (82.9%, a difference of 0.070%), Fijian (82.9%, a difference of 0.080%), and Native Hawaiian (82.9%, a difference of 0.090%).
| Demographics | Rating | Rank | In Labor Force | Age 25-29 |
| Nepalese | 0.0 /100 | #294 | Tragic 82.9% |
| Chippewa | 0.0 /100 | #295 | Tragic 82.9% |
| Immigrants | Nicaragua | 0.0 /100 | #296 | Tragic 82.9% |
| Potawatomi | 0.0 /100 | #297 | Tragic 82.9% |
| Native Hawaiians | 0.0 /100 | #298 | Tragic 82.9% |
| Fijians | 0.0 /100 | #299 | Tragic 82.9% |
| Spanish American Indians | 0.0 /100 | #300 | Tragic 82.9% |
| Vietnamese | 0.0 /100 | #301 | Tragic 82.8% |
| Immigrants | Belize | 0.0 /100 | #302 | Tragic 82.8% |
| Immigrants | Grenada | 0.0 /100 | #303 | Tragic 82.8% |
| Immigrants | St. Vincent and the Grenadines | 0.0 /100 | #304 | Tragic 82.7% |
| Blacks/African Americans | 0.0 /100 | #305 | Tragic 82.6% |
| Blackfeet | 0.0 /100 | #306 | Tragic 82.6% |
| Cajuns | 0.0 /100 | #307 | Tragic 82.5% |
| Central American Indians | 0.0 /100 | #308 | Tragic 82.4% |