Cuban vs Vietnamese In Labor Force | Age 25-29
COMPARE
Cuban
Vietnamese
In Labor Force | Age 25-29
In Labor Force | Age 25-29 Comparison
Cubans
Vietnamese
83.5%
IN LABOR FORCE | AGE 25-29
0.1/ 100
METRIC RATING
265th/ 347
METRIC RANK
82.8%
IN LABOR FORCE | AGE 25-29
0.0/ 100
METRIC RATING
301st/ 347
METRIC RANK
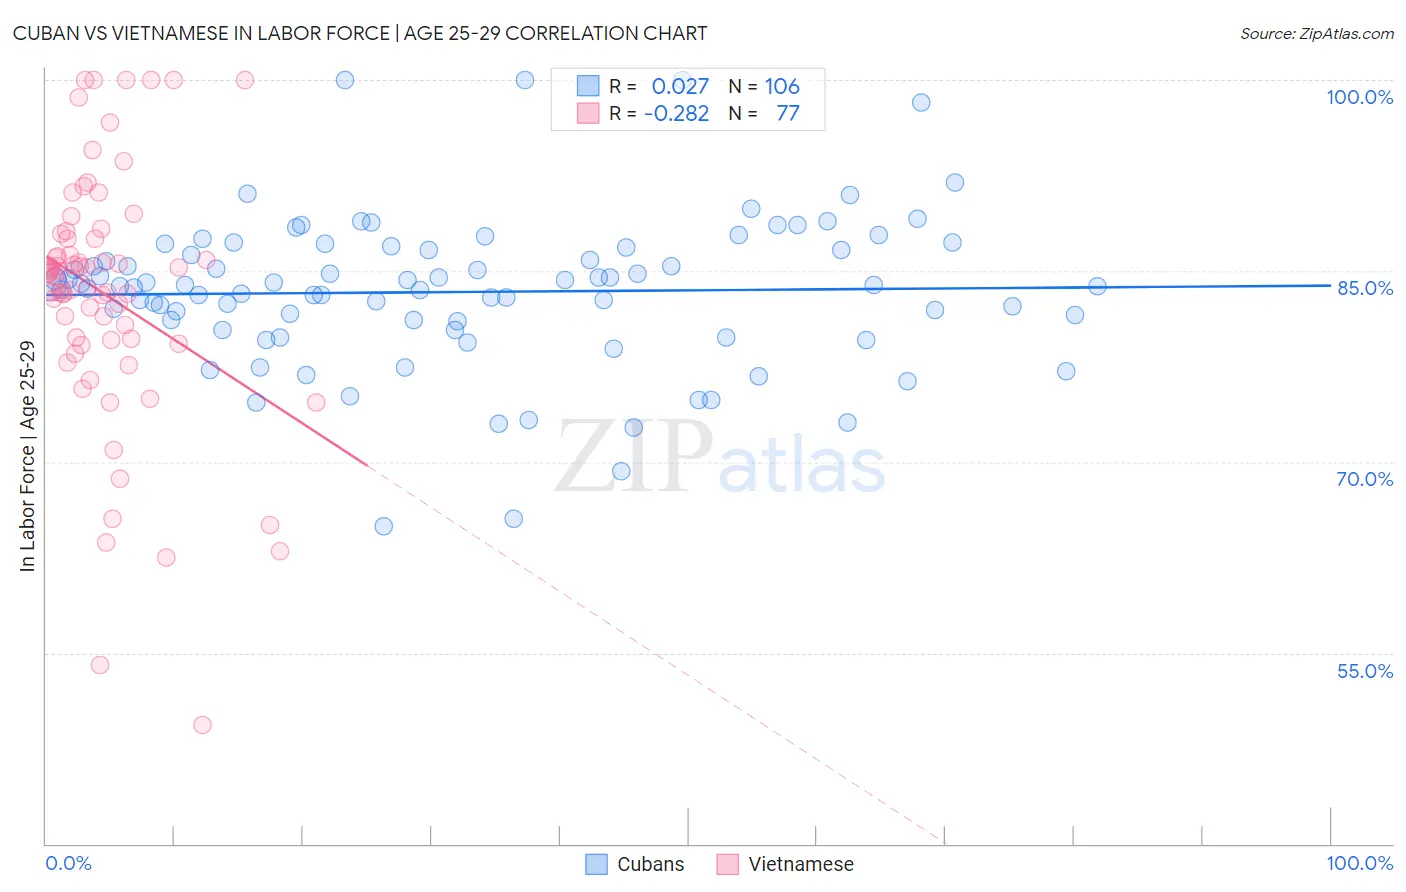
Cuban vs Vietnamese In Labor Force | Age 25-29 Correlation Chart
The statistical analysis conducted on geographies consisting of 449,082,313 people shows no correlation between the proportion of Cubans and labor force participation rate among population between the ages 25 and 29 in the United States with a correlation coefficient (R) of 0.027 and weighted average of 83.5%. Similarly, the statistical analysis conducted on geographies consisting of 170,737,570 people shows a weak negative correlation between the proportion of Vietnamese and labor force participation rate among population between the ages 25 and 29 in the United States with a correlation coefficient (R) of -0.282 and weighted average of 82.8%, a difference of 0.77%.
In Labor Force | Age 25-29 Correlation Summary
| Measurement | Cuban | Vietnamese |
| Minimum | 64.9% | 49.3% |
| Maximum | 100.0% | 100.0% |
| Range | 35.1% | 50.7% |
| Mean | 83.3% | 83.1% |
| Median | 83.8% | 84.9% |
| Interquartile 25% (IQ1) | 81.1% | 79.4% |
| Interquartile 75% (IQ3) | 86.6% | 87.7% |
| Interquartile Range (IQR) | 5.6% | 8.3% |
| Standard Deviation (Sample) | 6.0% | 10.0% |
| Standard Deviation (Population) | 5.9% | 9.9% |
Similar Demographics by In Labor Force | Age 25-29
Demographics Similar to Cubans by In Labor Force | Age 25-29
In terms of in labor force | age 25-29, the demographic groups most similar to Cubans are Puget Sound Salish (83.5%, a difference of 0.0%), Aleut (83.4%, a difference of 0.040%), Spanish American (83.4%, a difference of 0.050%), West Indian (83.5%, a difference of 0.060%), and Immigrants from Lebanon (83.4%, a difference of 0.060%).
| Demographics | Rating | Rank | In Labor Force | Age 25-29 |
| Immigrants | Guatemala | 0.1 /100 | #258 | Tragic 83.6% |
| Spanish | 0.1 /100 | #259 | Tragic 83.6% |
| Immigrants | Bahamas | 0.1 /100 | #260 | Tragic 83.6% |
| Pennsylvania Germans | 0.1 /100 | #261 | Tragic 83.6% |
| Immigrants | Fiji | 0.1 /100 | #262 | Tragic 83.6% |
| West Indians | 0.1 /100 | #263 | Tragic 83.5% |
| Puget Sound Salish | 0.1 /100 | #264 | Tragic 83.5% |
| Cubans | 0.1 /100 | #265 | Tragic 83.5% |
| Aleuts | 0.0 /100 | #266 | Tragic 83.4% |
| Spanish Americans | 0.0 /100 | #267 | Tragic 83.4% |
| Immigrants | Lebanon | 0.0 /100 | #268 | Tragic 83.4% |
| Immigrants | Barbados | 0.0 /100 | #269 | Tragic 83.4% |
| Basques | 0.0 /100 | #270 | Tragic 83.4% |
| Hondurans | 0.0 /100 | #271 | Tragic 83.4% |
| Immigrants | Caribbean | 0.0 /100 | #272 | Tragic 83.4% |
Demographics Similar to Vietnamese by In Labor Force | Age 25-29
In terms of in labor force | age 25-29, the demographic groups most similar to Vietnamese are Immigrants from Belize (82.8%, a difference of 0.030%), Immigrants from Grenada (82.8%, a difference of 0.050%), Spanish American Indian (82.9%, a difference of 0.070%), Fijian (82.9%, a difference of 0.080%), and Native Hawaiian (82.9%, a difference of 0.090%).
| Demographics | Rating | Rank | In Labor Force | Age 25-29 |
| Nepalese | 0.0 /100 | #294 | Tragic 82.9% |
| Chippewa | 0.0 /100 | #295 | Tragic 82.9% |
| Immigrants | Nicaragua | 0.0 /100 | #296 | Tragic 82.9% |
| Potawatomi | 0.0 /100 | #297 | Tragic 82.9% |
| Native Hawaiians | 0.0 /100 | #298 | Tragic 82.9% |
| Fijians | 0.0 /100 | #299 | Tragic 82.9% |
| Spanish American Indians | 0.0 /100 | #300 | Tragic 82.9% |
| Vietnamese | 0.0 /100 | #301 | Tragic 82.8% |
| Immigrants | Belize | 0.0 /100 | #302 | Tragic 82.8% |
| Immigrants | Grenada | 0.0 /100 | #303 | Tragic 82.8% |
| Immigrants | St. Vincent and the Grenadines | 0.0 /100 | #304 | Tragic 82.7% |
| Blacks/African Americans | 0.0 /100 | #305 | Tragic 82.6% |
| Blackfeet | 0.0 /100 | #306 | Tragic 82.6% |
| Cajuns | 0.0 /100 | #307 | Tragic 82.5% |
| Central American Indians | 0.0 /100 | #308 | Tragic 82.4% |