Immigrants from Colombia vs Sierra Leonean In Labor Force | Age 25-29
COMPARE
Immigrants from Colombia
Sierra Leonean
In Labor Force | Age 25-29
In Labor Force | Age 25-29 Comparison
Immigrants from Colombia
Sierra Leoneans
84.7%
IN LABOR FORCE | AGE 25-29
58.3/ 100
METRIC RATING
162nd/ 347
METRIC RANK
85.8%
IN LABOR FORCE | AGE 25-29
99.9/ 100
METRIC RATING
38th/ 347
METRIC RANK
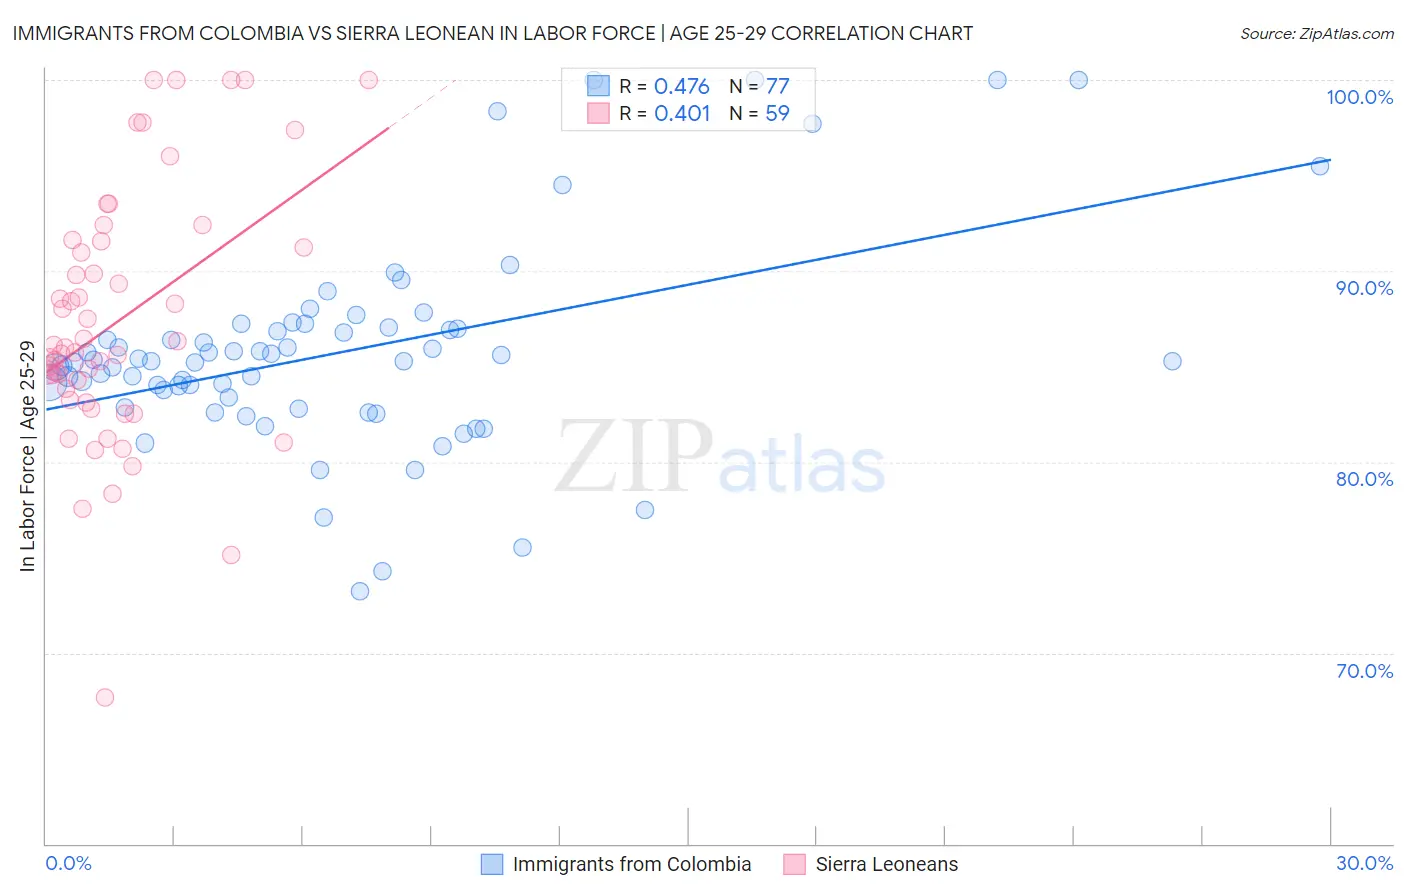
Immigrants from Colombia vs Sierra Leonean In Labor Force | Age 25-29 Correlation Chart
The statistical analysis conducted on geographies consisting of 378,572,642 people shows a moderate positive correlation between the proportion of Immigrants from Colombia and labor force participation rate among population between the ages 25 and 29 in the United States with a correlation coefficient (R) of 0.476 and weighted average of 84.7%. Similarly, the statistical analysis conducted on geographies consisting of 83,354,456 people shows a moderate positive correlation between the proportion of Sierra Leoneans and labor force participation rate among population between the ages 25 and 29 in the United States with a correlation coefficient (R) of 0.401 and weighted average of 85.8%, a difference of 1.2%.
In Labor Force | Age 25-29 Correlation Summary
| Measurement | Immigrants from Colombia | Sierra Leonean |
| Minimum | 73.2% | 67.6% |
| Maximum | 100.0% | 100.0% |
| Range | 26.8% | 32.4% |
| Mean | 85.8% | 87.4% |
| Median | 85.3% | 86.0% |
| Interquartile 25% (IQ1) | 83.1% | 83.2% |
| Interquartile 75% (IQ3) | 87.0% | 91.6% |
| Interquartile Range (IQR) | 3.9% | 8.3% |
| Standard Deviation (Sample) | 5.4% | 6.7% |
| Standard Deviation (Population) | 5.3% | 6.6% |
Similar Demographics by In Labor Force | Age 25-29
Demographics Similar to Immigrants from Colombia by In Labor Force | Age 25-29
In terms of in labor force | age 25-29, the demographic groups most similar to Immigrants from Colombia are Immigrants from Peru (84.7%, a difference of 0.0%), Canadian (84.7%, a difference of 0.0%), Argentinean (84.7%, a difference of 0.0%), Ghanaian (84.7%, a difference of 0.0%), and Immigrants from Ghana (84.7%, a difference of 0.010%).
| Demographics | Rating | Rank | In Labor Force | Age 25-29 |
| Indians (Asian) | 61.6 /100 | #155 | Good 84.7% |
| French | 61.0 /100 | #156 | Good 84.7% |
| British | 60.4 /100 | #157 | Good 84.7% |
| Immigrants | Ghana | 60.2 /100 | #158 | Good 84.7% |
| Immigrants | Western Africa | 60.1 /100 | #159 | Good 84.7% |
| Immigrants | Peru | 58.6 /100 | #160 | Average 84.7% |
| Canadians | 58.5 /100 | #161 | Average 84.7% |
| Immigrants | Colombia | 58.3 /100 | #162 | Average 84.7% |
| Argentineans | 57.9 /100 | #163 | Average 84.7% |
| Ghanaians | 57.6 /100 | #164 | Average 84.7% |
| Immigrants | Burma/Myanmar | 57.4 /100 | #165 | Average 84.7% |
| Immigrants | Spain | 56.9 /100 | #166 | Average 84.7% |
| Indonesians | 56.5 /100 | #167 | Average 84.7% |
| South Americans | 54.9 /100 | #168 | Average 84.7% |
| Celtics | 52.5 /100 | #169 | Average 84.7% |
Demographics Similar to Sierra Leoneans by In Labor Force | Age 25-29
In terms of in labor force | age 25-29, the demographic groups most similar to Sierra Leoneans are Croatian (85.8%, a difference of 0.0%), Polish (85.8%, a difference of 0.020%), Immigrants from Albania (85.7%, a difference of 0.020%), Immigrants from Greece (85.7%, a difference of 0.030%), and Cypriot (85.8%, a difference of 0.050%).
| Demographics | Rating | Rank | In Labor Force | Age 25-29 |
| German Russians | 100.0 /100 | #31 | Exceptional 85.8% |
| Slovaks | 100.0 /100 | #32 | Exceptional 85.8% |
| Immigrants | Bulgaria | 100.0 /100 | #33 | Exceptional 85.8% |
| Lithuanians | 99.9 /100 | #34 | Exceptional 85.8% |
| Cypriots | 99.9 /100 | #35 | Exceptional 85.8% |
| Immigrants | Nepal | 99.9 /100 | #36 | Exceptional 85.8% |
| Poles | 99.9 /100 | #37 | Exceptional 85.8% |
| Sierra Leoneans | 99.9 /100 | #38 | Exceptional 85.8% |
| Croatians | 99.9 /100 | #39 | Exceptional 85.8% |
| Immigrants | Albania | 99.9 /100 | #40 | Exceptional 85.7% |
| Immigrants | Greece | 99.9 /100 | #41 | Exceptional 85.7% |
| Immigrants | Eritrea | 99.9 /100 | #42 | Exceptional 85.7% |
| Immigrants | India | 99.9 /100 | #43 | Exceptional 85.7% |
| Macedonians | 99.9 /100 | #44 | Exceptional 85.7% |
| Immigrants | Sierra Leone | 99.9 /100 | #45 | Exceptional 85.7% |