Immigrants from Czechoslovakia vs Sierra Leonean In Labor Force | Age 25-29
COMPARE
Immigrants from Czechoslovakia
Sierra Leonean
In Labor Force | Age 25-29
In Labor Force | Age 25-29 Comparison
Immigrants from Czechoslovakia
Sierra Leoneans
85.4%
IN LABOR FORCE | AGE 25-29
99.3/ 100
METRIC RATING
65th/ 347
METRIC RANK
85.8%
IN LABOR FORCE | AGE 25-29
99.9/ 100
METRIC RATING
38th/ 347
METRIC RANK
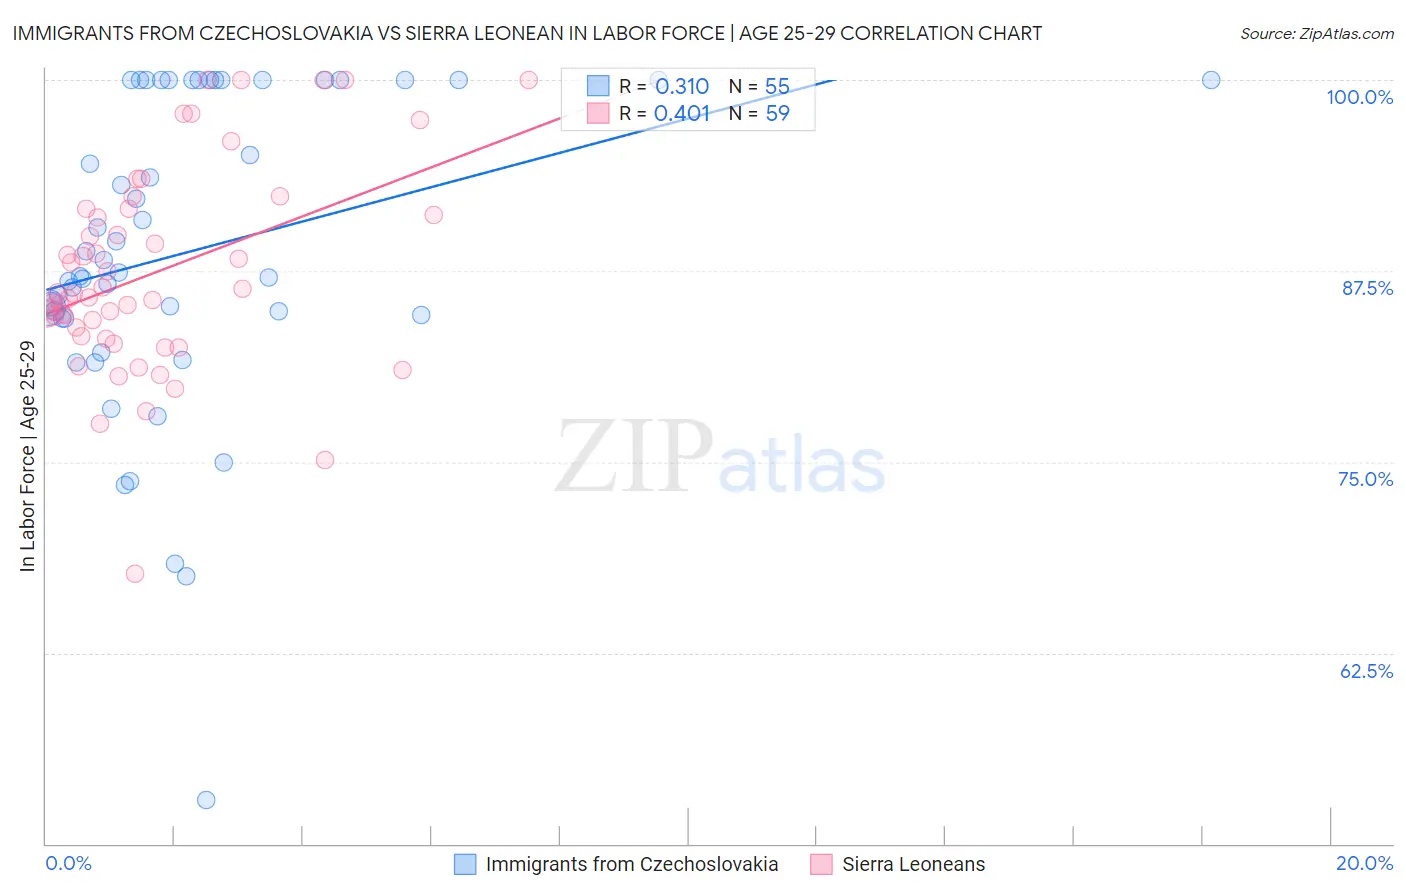
Immigrants from Czechoslovakia vs Sierra Leonean In Labor Force | Age 25-29 Correlation Chart
The statistical analysis conducted on geographies consisting of 195,420,999 people shows a mild positive correlation between the proportion of Immigrants from Czechoslovakia and labor force participation rate among population between the ages 25 and 29 in the United States with a correlation coefficient (R) of 0.310 and weighted average of 85.4%. Similarly, the statistical analysis conducted on geographies consisting of 83,354,456 people shows a moderate positive correlation between the proportion of Sierra Leoneans and labor force participation rate among population between the ages 25 and 29 in the United States with a correlation coefficient (R) of 0.401 and weighted average of 85.8%, a difference of 0.39%.
In Labor Force | Age 25-29 Correlation Summary
| Measurement | Immigrants from Czechoslovakia | Sierra Leonean |
| Minimum | 52.9% | 67.6% |
| Maximum | 100.0% | 100.0% |
| Range | 47.1% | 32.4% |
| Mean | 88.8% | 87.4% |
| Median | 87.4% | 86.0% |
| Interquartile 25% (IQ1) | 84.4% | 83.2% |
| Interquartile 75% (IQ3) | 100.0% | 91.6% |
| Interquartile Range (IQR) | 15.6% | 8.3% |
| Standard Deviation (Sample) | 10.2% | 6.7% |
| Standard Deviation (Population) | 10.1% | 6.6% |
Similar Demographics by In Labor Force | Age 25-29
Demographics Similar to Immigrants from Czechoslovakia by In Labor Force | Age 25-29
In terms of in labor force | age 25-29, the demographic groups most similar to Immigrants from Czechoslovakia are Immigrants from Italy (85.4%, a difference of 0.010%), Immigrants from Scotland (85.4%, a difference of 0.010%), Immigrants from Turkey (85.4%, a difference of 0.020%), Immigrants from Cameroon (85.4%, a difference of 0.020%), and Taiwanese (85.4%, a difference of 0.030%).
| Demographics | Rating | Rank | In Labor Force | Age 25-29 |
| Greeks | 99.6 /100 | #58 | Exceptional 85.5% |
| Immigrants | Morocco | 99.5 /100 | #59 | Exceptional 85.5% |
| Thais | 99.5 /100 | #60 | Exceptional 85.5% |
| Serbians | 99.5 /100 | #61 | Exceptional 85.5% |
| Taiwanese | 99.4 /100 | #62 | Exceptional 85.4% |
| Immigrants | Kenya | 99.4 /100 | #63 | Exceptional 85.4% |
| Immigrants | Italy | 99.3 /100 | #64 | Exceptional 85.4% |
| Immigrants | Czechoslovakia | 99.3 /100 | #65 | Exceptional 85.4% |
| Immigrants | Scotland | 99.3 /100 | #66 | Exceptional 85.4% |
| Immigrants | Turkey | 99.2 /100 | #67 | Exceptional 85.4% |
| Immigrants | Cameroon | 99.2 /100 | #68 | Exceptional 85.4% |
| Menominee | 99.1 /100 | #69 | Exceptional 85.4% |
| Immigrants | Sweden | 99.1 /100 | #70 | Exceptional 85.4% |
| Kenyans | 99.0 /100 | #71 | Exceptional 85.4% |
| Immigrants | Australia | 98.9 /100 | #72 | Exceptional 85.3% |
Demographics Similar to Sierra Leoneans by In Labor Force | Age 25-29
In terms of in labor force | age 25-29, the demographic groups most similar to Sierra Leoneans are Croatian (85.8%, a difference of 0.0%), Polish (85.8%, a difference of 0.020%), Immigrants from Albania (85.7%, a difference of 0.020%), Immigrants from Greece (85.7%, a difference of 0.030%), and Cypriot (85.8%, a difference of 0.050%).
| Demographics | Rating | Rank | In Labor Force | Age 25-29 |
| German Russians | 100.0 /100 | #31 | Exceptional 85.8% |
| Slovaks | 100.0 /100 | #32 | Exceptional 85.8% |
| Immigrants | Bulgaria | 100.0 /100 | #33 | Exceptional 85.8% |
| Lithuanians | 99.9 /100 | #34 | Exceptional 85.8% |
| Cypriots | 99.9 /100 | #35 | Exceptional 85.8% |
| Immigrants | Nepal | 99.9 /100 | #36 | Exceptional 85.8% |
| Poles | 99.9 /100 | #37 | Exceptional 85.8% |
| Sierra Leoneans | 99.9 /100 | #38 | Exceptional 85.8% |
| Croatians | 99.9 /100 | #39 | Exceptional 85.8% |
| Immigrants | Albania | 99.9 /100 | #40 | Exceptional 85.7% |
| Immigrants | Greece | 99.9 /100 | #41 | Exceptional 85.7% |
| Immigrants | Eritrea | 99.9 /100 | #42 | Exceptional 85.7% |
| Immigrants | India | 99.9 /100 | #43 | Exceptional 85.7% |
| Macedonians | 99.9 /100 | #44 | Exceptional 85.7% |
| Immigrants | Sierra Leone | 99.9 /100 | #45 | Exceptional 85.7% |