Immigrants from Cameroon vs Indonesian In Labor Force | Age 45-54
COMPARE
Immigrants from Cameroon
Indonesian
In Labor Force | Age 45-54
In Labor Force | Age 45-54 Comparison
Immigrants from Cameroon
Indonesians
84.6%
IN LABOR FORCE | AGE 45-54
100.0/ 100
METRIC RATING
7th/ 347
METRIC RANK
81.5%
IN LABOR FORCE | AGE 45-54
0.1/ 100
METRIC RATING
263rd/ 347
METRIC RANK
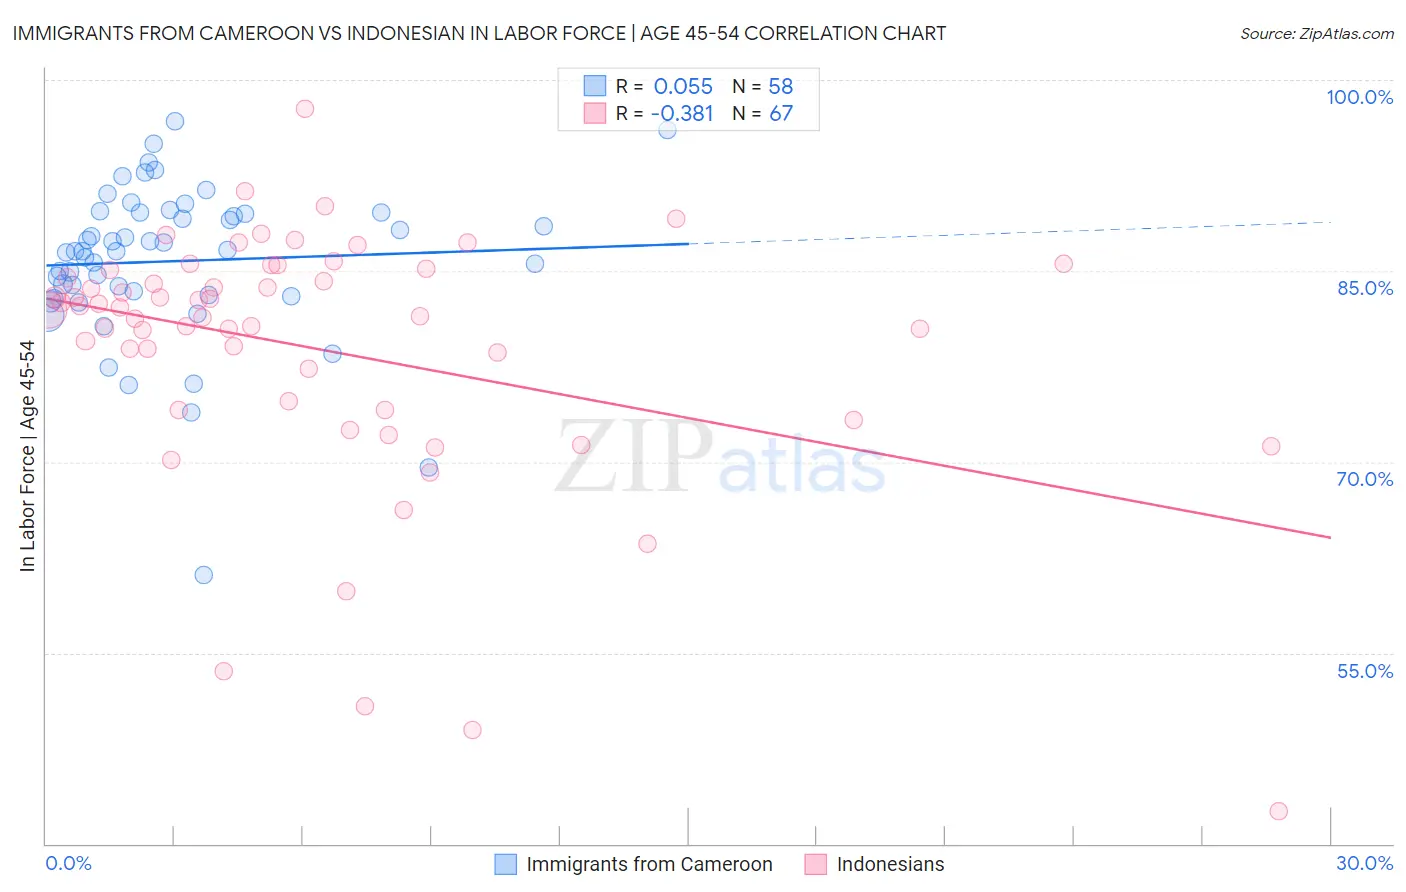
Immigrants from Cameroon vs Indonesian In Labor Force | Age 45-54 Correlation Chart
The statistical analysis conducted on geographies consisting of 130,722,370 people shows a slight positive correlation between the proportion of Immigrants from Cameroon and labor force participation rate among population between the ages 45 and 54 in the United States with a correlation coefficient (R) of 0.055 and weighted average of 84.6%. Similarly, the statistical analysis conducted on geographies consisting of 162,640,204 people shows a mild negative correlation between the proportion of Indonesians and labor force participation rate among population between the ages 45 and 54 in the United States with a correlation coefficient (R) of -0.381 and weighted average of 81.5%, a difference of 3.8%.
In Labor Force | Age 45-54 Correlation Summary
| Measurement | Immigrants from Cameroon | Indonesian |
| Minimum | 61.1% | 42.6% |
| Maximum | 96.8% | 97.7% |
| Range | 35.7% | 55.1% |
| Mean | 85.8% | 78.8% |
| Median | 86.5% | 81.9% |
| Interquartile 25% (IQ1) | 83.1% | 74.1% |
| Interquartile 75% (IQ3) | 89.6% | 85.0% |
| Interquartile Range (IQR) | 6.5% | 10.9% |
| Standard Deviation (Sample) | 6.2% | 10.1% |
| Standard Deviation (Population) | 6.2% | 10.0% |
Similar Demographics by In Labor Force | Age 45-54
Demographics Similar to Immigrants from Cameroon by In Labor Force | Age 45-54
In terms of in labor force | age 45-54, the demographic groups most similar to Immigrants from Cameroon are Immigrants from India (84.7%, a difference of 0.070%), Sierra Leonean (84.5%, a difference of 0.11%), Ethiopian (84.8%, a difference of 0.18%), Immigrants from Sierra Leone (84.4%, a difference of 0.22%), and Norwegian (84.4%, a difference of 0.24%).
| Demographics | Rating | Rank | In Labor Force | Age 45-54 |
| Immigrants | Bolivia | 100.0 /100 | #1 | Exceptional 85.3% |
| Luxembourgers | 100.0 /100 | #2 | Exceptional 85.0% |
| Bolivians | 100.0 /100 | #3 | Exceptional 84.9% |
| Immigrants | Ethiopia | 100.0 /100 | #4 | Exceptional 84.8% |
| Ethiopians | 100.0 /100 | #5 | Exceptional 84.8% |
| Immigrants | India | 100.0 /100 | #6 | Exceptional 84.7% |
| Immigrants | Cameroon | 100.0 /100 | #7 | Exceptional 84.6% |
| Sierra Leoneans | 100.0 /100 | #8 | Exceptional 84.5% |
| Immigrants | Sierra Leone | 100.0 /100 | #9 | Exceptional 84.4% |
| Norwegians | 100.0 /100 | #10 | Exceptional 84.4% |
| Thais | 100.0 /100 | #11 | Exceptional 84.3% |
| Bulgarians | 100.0 /100 | #12 | Exceptional 84.2% |
| Chinese | 99.9 /100 | #13 | Exceptional 84.1% |
| Cambodians | 99.9 /100 | #14 | Exceptional 84.1% |
| Cypriots | 99.9 /100 | #15 | Exceptional 84.1% |
Demographics Similar to Indonesians by In Labor Force | Age 45-54
In terms of in labor force | age 45-54, the demographic groups most similar to Indonesians are Hawaiian (81.5%, a difference of 0.010%), Immigrants from Guyana (81.5%, a difference of 0.010%), Immigrants from West Indies (81.5%, a difference of 0.010%), Spaniard (81.5%, a difference of 0.030%), and Guyanese (81.5%, a difference of 0.050%).
| Demographics | Rating | Rank | In Labor Force | Age 45-54 |
| Barbadians | 0.1 /100 | #256 | Tragic 81.6% |
| Immigrants | Congo | 0.1 /100 | #257 | Tragic 81.6% |
| Immigrants | Fiji | 0.1 /100 | #258 | Tragic 81.5% |
| Guyanese | 0.1 /100 | #259 | Tragic 81.5% |
| Spaniards | 0.1 /100 | #260 | Tragic 81.5% |
| Hawaiians | 0.1 /100 | #261 | Tragic 81.5% |
| Immigrants | Guyana | 0.1 /100 | #262 | Tragic 81.5% |
| Indonesians | 0.1 /100 | #263 | Tragic 81.5% |
| Immigrants | West Indies | 0.1 /100 | #264 | Tragic 81.5% |
| Hondurans | 0.1 /100 | #265 | Tragic 81.4% |
| Immigrants | St. Vincent and the Grenadines | 0.1 /100 | #266 | Tragic 81.4% |
| West Indians | 0.1 /100 | #267 | Tragic 81.4% |
| Immigrants | Honduras | 0.0 /100 | #268 | Tragic 81.4% |
| Alsatians | 0.0 /100 | #269 | Tragic 81.3% |
| Bangladeshis | 0.0 /100 | #270 | Tragic 81.3% |