Immigrants from Cambodia vs Slovak Disability Age 18 to 34
COMPARE
Immigrants from Cambodia
Slovak
Disability Age 18 to 34
Disability Age 18 to 34 Comparison
Immigrants from Cambodia
Slovaks
6.6%
DISABILITY AGE 18 TO 34
46.5/ 100
METRIC RATING
175th/ 347
METRIC RANK
7.7%
DISABILITY AGE 18 TO 34
0.0/ 100
METRIC RATING
290th/ 347
METRIC RANK
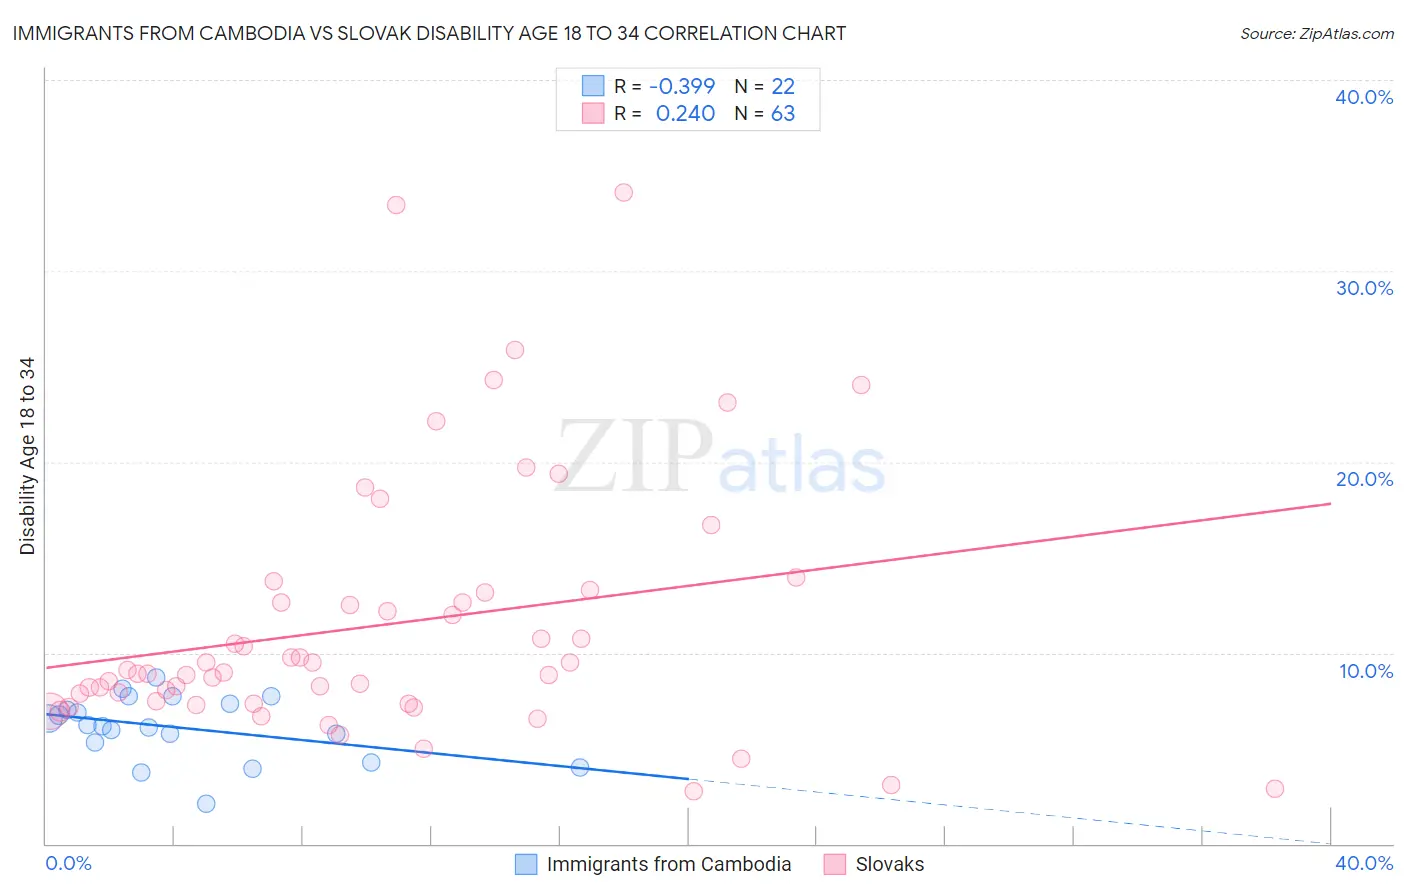
Immigrants from Cambodia vs Slovak Disability Age 18 to 34 Correlation Chart
The statistical analysis conducted on geographies consisting of 205,039,723 people shows a mild negative correlation between the proportion of Immigrants from Cambodia and percentage of population with a disability between the ages 18 and 35 in the United States with a correlation coefficient (R) of -0.399 and weighted average of 6.6%. Similarly, the statistical analysis conducted on geographies consisting of 396,424,905 people shows a weak positive correlation between the proportion of Slovaks and percentage of population with a disability between the ages 18 and 35 in the United States with a correlation coefficient (R) of 0.240 and weighted average of 7.7%, a difference of 15.7%.
Disability Age 18 to 34 Correlation Summary
| Measurement | Immigrants from Cambodia | Slovak |
| Minimum | 2.1% | 2.8% |
| Maximum | 8.7% | 34.1% |
| Range | 6.6% | 31.4% |
| Mean | 6.1% | 11.5% |
| Median | 6.2% | 9.0% |
| Interquartile 25% (IQ1) | 5.3% | 7.3% |
| Interquartile 75% (IQ3) | 7.3% | 13.2% |
| Interquartile Range (IQR) | 2.1% | 5.8% |
| Standard Deviation (Sample) | 1.7% | 6.7% |
| Standard Deviation (Population) | 1.6% | 6.6% |
Similar Demographics by Disability Age 18 to 34
Demographics Similar to Immigrants from Cambodia by Disability Age 18 to 34
In terms of disability age 18 to 34, the demographic groups most similar to Immigrants from Cambodia are Immigrants from Africa (6.6%, a difference of 0.040%), Syrian (6.6%, a difference of 0.15%), Nigerian (6.6%, a difference of 0.19%), Native Hawaiian (6.6%, a difference of 0.24%), and Immigrants from Ghana (6.6%, a difference of 0.30%).
| Demographics | Rating | Rank | Disability Age 18 to 34 |
| Immigrants | Moldova | 63.1 /100 | #168 | Good 6.5% |
| Russians | 60.2 /100 | #169 | Good 6.5% |
| Immigrants | Bahamas | 57.9 /100 | #170 | Average 6.6% |
| Bahamians | 55.5 /100 | #171 | Average 6.6% |
| Ghanaians | 54.7 /100 | #172 | Average 6.6% |
| Immigrants | Mexico | 54.1 /100 | #173 | Average 6.6% |
| Native Hawaiians | 50.0 /100 | #174 | Average 6.6% |
| Immigrants | Cambodia | 46.5 /100 | #175 | Average 6.6% |
| Immigrants | Africa | 45.9 /100 | #176 | Average 6.6% |
| Syrians | 44.3 /100 | #177 | Average 6.6% |
| Nigerians | 43.7 /100 | #178 | Average 6.6% |
| Immigrants | Ghana | 42.1 /100 | #179 | Average 6.6% |
| Immigrants | Austria | 39.6 /100 | #180 | Fair 6.6% |
| Romanians | 39.5 /100 | #181 | Fair 6.6% |
| U.S. Virgin Islanders | 38.6 /100 | #182 | Fair 6.7% |
Demographics Similar to Slovaks by Disability Age 18 to 34
In terms of disability age 18 to 34, the demographic groups most similar to Slovaks are Irish (7.7%, a difference of 0.040%), Nonimmigrants (7.6%, a difference of 0.090%), White/Caucasian (7.6%, a difference of 0.21%), Black/African American (7.7%, a difference of 0.27%), and Norwegian (7.6%, a difference of 0.31%).
| Demographics | Rating | Rank | Disability Age 18 to 34 |
| Danes | 0.0 /100 | #283 | Tragic 7.5% |
| Hopi | 0.0 /100 | #284 | Tragic 7.5% |
| Swedes | 0.0 /100 | #285 | Tragic 7.5% |
| Celtics | 0.0 /100 | #286 | Tragic 7.6% |
| Norwegians | 0.0 /100 | #287 | Tragic 7.6% |
| Whites/Caucasians | 0.0 /100 | #288 | Tragic 7.6% |
| Immigrants | Nonimmigrants | 0.0 /100 | #289 | Tragic 7.6% |
| Slovaks | 0.0 /100 | #290 | Tragic 7.7% |
| Irish | 0.0 /100 | #291 | Tragic 7.7% |
| Blacks/African Americans | 0.0 /100 | #292 | Tragic 7.7% |
| Scandinavians | 0.0 /100 | #293 | Tragic 7.7% |
| Immigrants | Cabo Verde | 0.0 /100 | #294 | Tragic 7.7% |
| Tlingit-Haida | 0.0 /100 | #295 | Tragic 7.7% |
| Cape Verdeans | 0.0 /100 | #296 | Tragic 7.7% |
| Pueblo | 0.0 /100 | #297 | Tragic 7.7% |