Immigrants from Bolivia vs Yuman In Labor Force | Age > 16

COMPARE

Immigrants from Bolivia
Race
Ancestry
AfghanAfricanAlaska NativeAlaskan AthabascanAlbanianAleutAlsatianAmericanApacheArabArapahoArgentineanArmenianAssyrian/Chaldean/SyriacAustralianAustrianBahamianBangladeshiBarbadianBasqueBelgianBelizeanBermudanBhutaneseBlackfeetBolivianBrazilianBritishBritish West IndianBulgarianBurmeseCajunCambodianCanadianCape VerdeanCarpatho RusynCelticCentral AmericanCentral American IndianCherokeeCheyenneChickasawChileanChineseChippewaChoctawColombianColvilleComancheCosta RicanCreeCreekCroatianCrowCubanCypriotCzechCzechoslovakianDanishDelawareDominicanDutchDutch West IndianEastern EuropeanEcuadorianEgyptianEnglishEstonianEthiopianEuropeanFijianFilipinoFinnishFrenchFrench American IndianFrench CanadianGermanGerman RussianGhanaianGreekGuamanian/ChamorroGuatemalanGuyaneseHaitianHmongHonduranHopiHoumaHungarianIcelanderIndian (Asian)IndonesianInupiatIranianIraqiIrishIroquoisIsraeliItalianJamaicanJapaneseJordanianKenyanKiowaKoreanLaotianLatvianLebaneseLiberianLithuanianLumbeeLuxembourgerMacedonianMalaysianMalteseMarshalleseMenomineeMexicanMexican American IndianMongolianMoroccanNative HawaiianNavajoNepaleseNew ZealanderNicaraguanNigerianNorthern EuropeanNorwegianOkinawanOsageOttawaPaiutePakistaniPalestinianPanamanianParaguayanPennsylvania GermanPeruvianPimaPolishPortuguesePotawatomiPuebloPuerto RicanPuget Sound SalishRomanianRussianSalvadoranSamoanScandinavianScotch-IrishScottishSeminoleSenegaleseSerbianShoshoneSierra LeoneanSiouxSlavicSlovakSloveneSomaliSouth AfricanSouth AmericanSouth American IndianSoviet UnionSpaniardSpanishSpanish AmericanSpanish American IndianSri LankanSubsaharan AfricanSudaneseSwedishSwissSyrianTaiwaneseThaiTlingit-HaidaTohono O'OdhamTonganTrinidadian and TobagonianTsimshianTurkishU.S. Virgin IslanderUgandanUkrainianUruguayanUteVenezuelanVietnameseWelshWest IndianYakamaYaquiYugoslavianYup'ikZimbabwean
Immigration
NonimmigrantsImmigrantsAfghanistanAfricaAlbaniaArgentinaArmeniaAsiaAustraliaAustriaBahamasBangladeshBarbadosBelarusBelgiumBelizeBoliviaBosnia and HerzegovinaBrazilBulgariaBurma/MyanmarCabo VerdeCambodiaCameroonCanadaCaribbeanCentral AmericaChileChinaColombiaCongoCosta RicaCroatiaCubaCzechoslovakiaDenmarkDominicaDominican RepublicEastern AfricaEastern AsiaEastern EuropeEcuadorEgyptEl SalvadorEnglandEritreaEthiopiaEuropeFijiFranceGermanyGhanaGreeceGrenadaGuatemalaGuyanaHaitiHondurasHong KongHungaryIndiaIndonesiaIranIraqIrelandIsraelItalyJamaicaJapanJordanKazakhstanKenyaKoreaKuwaitLaosLatin AmericaLatviaLebanonLiberiaLithuaniaMalaysiaMexicoMicronesiaMiddle AfricaMoldovaMoroccoNepalNetherlandsNicaraguaNigeriaNorth AmericaNorth MacedoniaNorthern AfricaNorthern EuropeNorwayOceaniaPakistanPanamaPeruPhilippinesPolandPortugalRomaniaRussiaSaudi ArabiaScotlandSenegalSerbiaSierra LeoneSingaporeSomaliaSouth AfricaSouth AmericaSouth Central AsiaSouth Eastern AsiaSouthern EuropeSpainSri LankaSt. Vincent and the GrenadinesSudanSwedenSwitzerlandSyriaTaiwanThailandTrinidad and TobagoTurkeyUgandaUkraineUruguayUzbekistanVenezuelaVietnamWest IndiesWestern AfricaWestern AsiaWestern EuropeYemenZaireZimbabweAzores
Yuman
Race
Ancestry
AfghanAfricanAlaska NativeAlaskan AthabascanAlbanianAleutAlsatianAmericanApacheArabArapahoArgentineanArmenianAssyrian/Chaldean/SyriacAustralianAustrianBahamianBangladeshiBarbadianBasqueBelgianBelizeanBermudanBhutaneseBlackfeetBolivianBrazilianBritishBritish West IndianBulgarianBurmeseCajunCambodianCanadianCape VerdeanCarpatho RusynCelticCentral AmericanCentral American IndianCherokeeCheyenneChickasawChileanChineseChippewaChoctawColombianColvilleComancheCosta RicanCreeCreekCroatianCrowCubanCypriotCzechCzechoslovakianDanishDelawareDominicanDutchDutch West IndianEastern EuropeanEcuadorianEgyptianEnglishEstonianEthiopianEuropeanFijianFilipinoFinnishFrenchFrench American IndianFrench CanadianGermanGerman RussianGhanaianGreekGuamanian/ChamorroGuatemalanGuyaneseHaitianHmongHonduranHopiHoumaHungarianIcelanderIndian (Asian)IndonesianInupiatIranianIraqiIrishIroquoisIsraeliItalianJamaicanJapaneseJordanianKenyanKiowaKoreanLaotianLatvianLebaneseLiberianLithuanianLumbeeLuxembourgerMacedonianMalaysianMalteseMarshalleseMenomineeMexicanMexican American IndianMongolianMoroccanNative HawaiianNavajoNepaleseNew ZealanderNicaraguanNigerianNorthern EuropeanNorwegianOkinawanOsageOttawaPaiutePakistaniPalestinianPanamanianParaguayanPennsylvania GermanPeruvianPimaPolishPortuguesePotawatomiPuebloPuerto RicanPuget Sound SalishRomanianRussianSalvadoranSamoanScandinavianScotch-IrishScottishSeminoleSenegaleseSerbianShoshoneSierra LeoneanSiouxSlavicSlovakSloveneSomaliSouth AfricanSouth AmericanSouth American IndianSoviet UnionSpaniardSpanishSpanish AmericanSpanish American IndianSri LankanSubsaharan AfricanSudaneseSwedishSwissSyrianTaiwaneseThaiTlingit-HaidaTohono O'OdhamTonganTrinidadian and TobagonianTsimshianTurkishU.S. Virgin IslanderUgandanUkrainianUruguayanUteVenezuelanVietnameseWelshWest IndianYakamaYaquiYugoslavianYumanYup'ikZimbabwean
Immigration
NonimmigrantsImmigrantsAfghanistanAfricaAlbaniaArgentinaArmeniaAsiaAustraliaAustriaBahamasBangladeshBarbadosBelarusBelgiumBelizeBosnia and HerzegovinaBrazilBulgariaBurma/MyanmarCabo VerdeCambodiaCameroonCanadaCaribbeanCentral AmericaChileChinaColombiaCongoCosta RicaCroatiaCubaCzechoslovakiaDenmarkDominicaDominican RepublicEastern AfricaEastern AsiaEastern EuropeEcuadorEgyptEl SalvadorEnglandEritreaEthiopiaEuropeFijiFranceGermanyGhanaGreeceGrenadaGuatemalaGuyanaHaitiHondurasHong KongHungaryIndiaIndonesiaIranIraqIrelandIsraelItalyJamaicaJapanJordanKazakhstanKenyaKoreaKuwaitLaosLatin AmericaLatviaLebanonLiberiaLithuaniaMalaysiaMexicoMicronesiaMiddle AfricaMoldovaMoroccoNepalNetherlandsNicaraguaNigeriaNorth AmericaNorth MacedoniaNorthern AfricaNorthern EuropeNorwayOceaniaPakistanPanamaPeruPhilippinesPolandPortugalRomaniaRussiaSaudi ArabiaScotlandSenegalSerbiaSierra LeoneSingaporeSomaliaSouth AfricaSouth AmericaSouth Central AsiaSouth Eastern AsiaSouthern EuropeSpainSri LankaSt. Vincent and the GrenadinesSudanSwedenSwitzerlandSyriaTaiwanThailandTrinidad and TobagoTurkeyUgandaUkraineUruguayUzbekistanVenezuelaVietnamWest IndiesWestern AfricaWestern AsiaWestern EuropeYemenZaireZimbabweAzores
In Labor Force | Age > 16
Income
Poverty
Unemployment
Labor Participation
Family Structure
Vehicle Availability
Education Level
Disability

In Labor Force | Age > 16 Comparison

Immigrants from Bolivia

Yuman

Exceptional
Tragic
68.4%
IN LABOR FORCE | AGE > 16
100.0/ 100
METRIC RATING
10th/ 347
METRIC RANK
57.8%
IN LABOR FORCE | AGE > 16
0.0/ 100
METRIC RATING
343rd/ 347
METRIC RANK

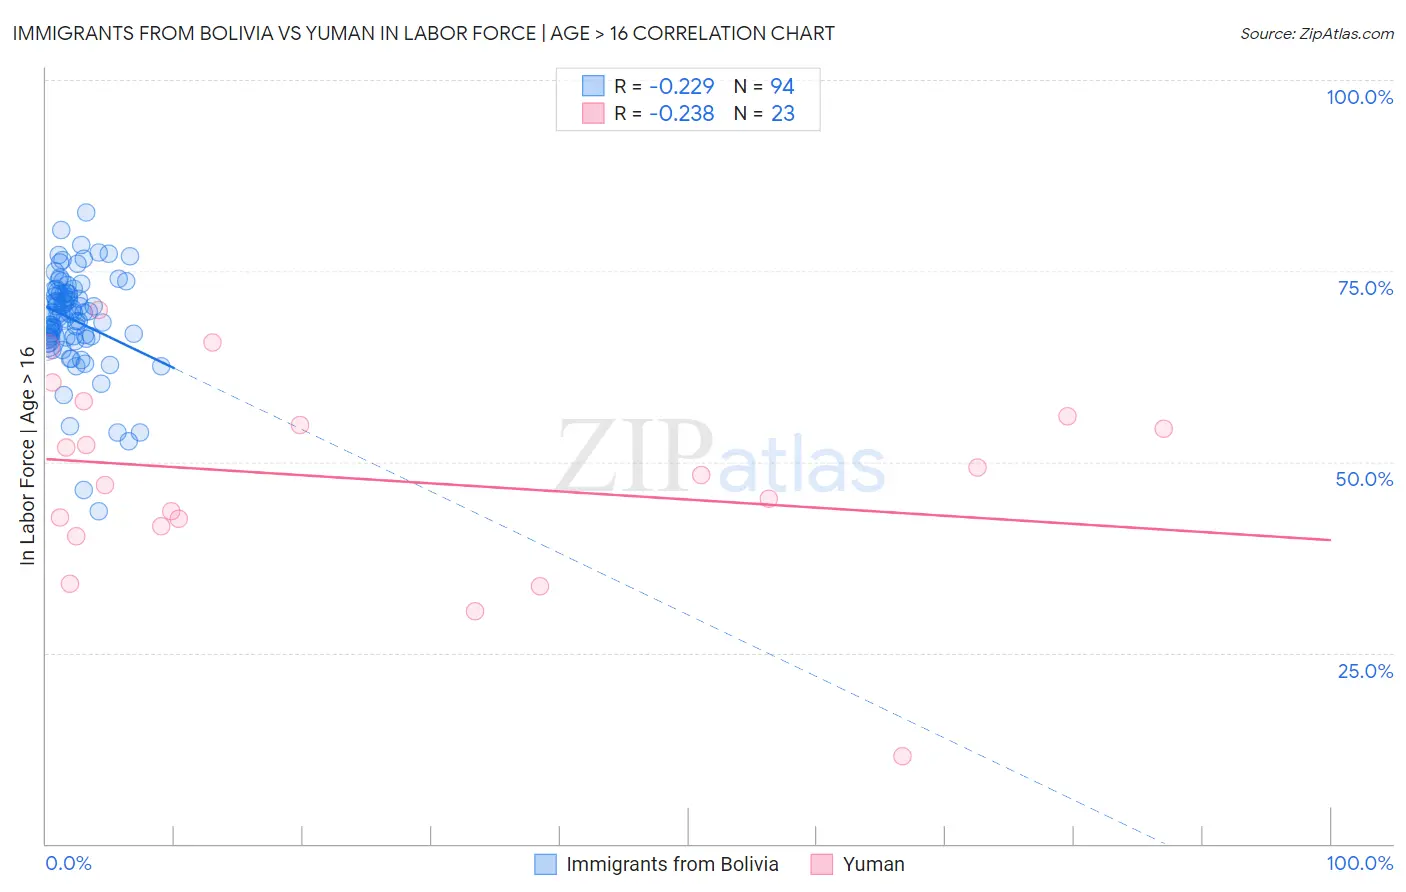
Immigrants from Bolivia vs Yuman In Labor Force | Age > 16 Correlation Chart

The statistical analysis conducted on geographies consisting of 158,722,448 people shows a weak negative correlation between the proportion of Immigrants from Bolivia and labor force participation rate among population ages 16 and over in the United States with a correlation coefficient (R) of -0.229 and weighted average of 68.4%. Similarly, the statistical analysis conducted on geographies consisting of 40,686,052 people shows a weak negative correlation between the proportion of Yuman and labor force participation rate among population ages 16 and over in the United States with a correlation coefficient (R) of -0.238 and weighted average of 57.8%, a difference of 18.4%.
Immigrants from Bolivia vs Yuman In Labor Force | Age > 16

In Labor Force | Age > 16 Correlation Summary

MeasurementImmigrants from BoliviaYuman
Minimum43.5%11.5%
Maximum82.6%69.9%
Range39.1%58.4%
Mean68.6%47.7%
Median69.4%48.3%
Interquartile 25% (IQ1)66.2%41.5%
Interquartile 75% (IQ3)72.1%55.9%
Interquartile Range (IQR)5.9%14.4%
Standard Deviation (Sample)6.5%13.0%
Standard Deviation (Population)6.4%12.8%

Similar Demographics by In Labor Force | Age > 16

Demographics Similar to Immigrants from Bolivia by In Labor Force | Age > 16

In terms of in labor force | age > 16, the demographic groups most similar to Immigrants from Bolivia are Immigrants from Eastern Africa (68.5%, a difference of 0.030%), Immigrants from Sierra Leone (68.5%, a difference of 0.050%), Immigrants from Cameroon (68.7%, a difference of 0.36%), Bolivian (68.2%, a difference of 0.37%), and Sudanese (68.0%, a difference of 0.59%).
DemographicsRating | RankIn Labor Force | Age > 16
Somalis
100.0
/100
|
#3
Exceptional
69.2%
Immigrants | Somalia
100.0
/100
|
#4
Exceptional
69.1%
Sierra Leoneans
100.0
/100
|
#5
Exceptional
68.9%
Immigrants | Eritrea
100.0
/100
|
#6
Exceptional
68.9%
Immigrants | Cameroon
100.0
/100
|
#7
Exceptional
68.7%
Immigrants | Sierra Leone
100.0
/100
|
#8
Exceptional
68.5%
Immigrants | Eastern Africa
100.0
/100
|
#9
Exceptional
68.5%
Immigrants | Bolivia
100.0
/100
|
#10
Exceptional
68.4%
Bolivians
100.0
/100
|
#11
Exceptional
68.2%
Sudanese
100.0
/100
|
#12
Exceptional
68.0%
Immigrants | Nepal
100.0
/100
|
#13
Exceptional
68.0%
Liberians
100.0
/100
|
#14
Exceptional
67.8%
Immigrants | Middle Africa
100.0
/100
|
#15
Exceptional
67.7%
Immigrants | Sudan
100.0
/100
|
#16
Exceptional
67.7%
Immigrants | India
100.0
/100
|
#17
Exceptional
67.6%

Demographics Similar to Yuman by In Labor Force | Age > 16

In terms of in labor force | age > 16, the demographic groups most similar to Yuman are Puerto Rican (58.1%, a difference of 0.52%), Pima (57.4%, a difference of 0.70%), Hopi (58.4%, a difference of 0.99%), Tohono O'odham (57.2%, a difference of 0.99%), and Lumbee (56.8%, a difference of 1.8%).
DemographicsRating | RankIn Labor Force | Age > 16
Paiute
0.0
/100
|
#333
Tragic
60.7%
Apache
0.0
/100
|
#334
Tragic
60.7%
Natives/Alaskans
0.0
/100
|
#335
Tragic
60.6%
Menominee
0.0
/100
|
#336
Tragic
60.6%
Colville
0.0
/100
|
#337
Tragic
59.8%
Immigrants | Yemen
0.0
/100
|
#338
Tragic
59.6%
Houma
0.0
/100
|
#339
Tragic
59.5%
Pueblo
0.0
/100
|
#340
Tragic
59.3%
Hopi
0.0
/100
|
#341
Tragic
58.4%
Puerto Ricans
0.0
/100
|
#342
Tragic
58.1%
Yuman
0.0
/100
|
#343
Tragic
57.8%
Pima
0.0
/100
|
#344
Tragic
57.4%
Tohono O'odham
0.0
/100
|
#345
Tragic
57.2%
Lumbee
0.0
/100
|
#346
Tragic
56.8%
Navajo
0.0
/100
|
#347
Tragic
56.6%