Immigrants from Africa vs Basque In Labor Force | Age > 16
COMPARE
Immigrants from Africa
Basque
In Labor Force | Age > 16
In Labor Force | Age > 16 Comparison
Immigrants from Africa
Basques
67.4%
IN LABOR FORCE | AGE > 16
100.0/ 100
METRIC RATING
25th/ 347
METRIC RANK
64.2%
IN LABOR FORCE | AGE > 16
0.7/ 100
METRIC RATING
261st/ 347
METRIC RANK
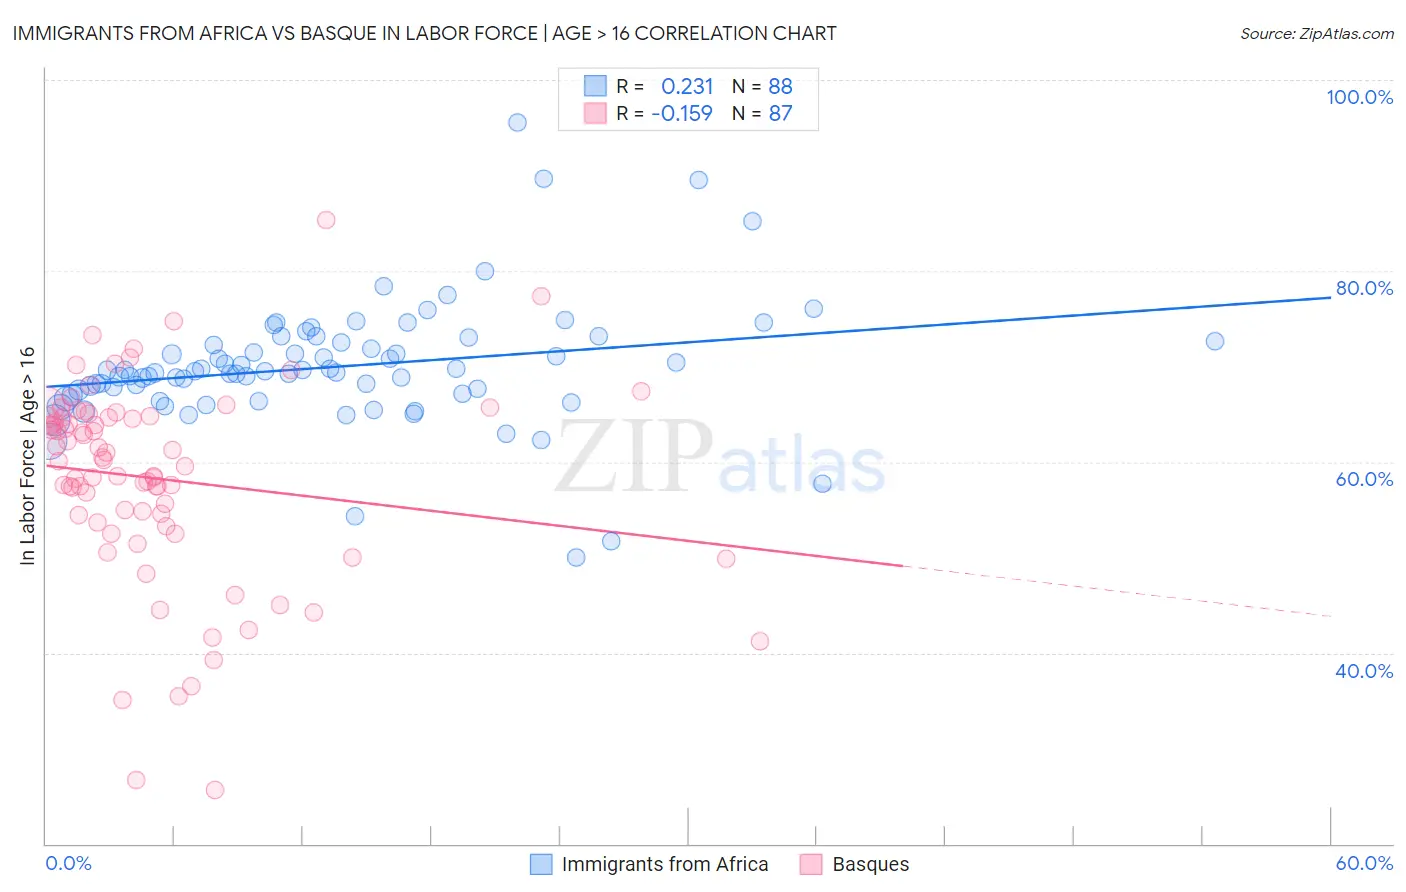
Immigrants from Africa vs Basque In Labor Force | Age > 16 Correlation Chart
The statistical analysis conducted on geographies consisting of 469,450,082 people shows a weak positive correlation between the proportion of Immigrants from Africa and labor force participation rate among population ages 16 and over in the United States with a correlation coefficient (R) of 0.231 and weighted average of 67.4%. Similarly, the statistical analysis conducted on geographies consisting of 165,779,743 people shows a poor negative correlation between the proportion of Basques and labor force participation rate among population ages 16 and over in the United States with a correlation coefficient (R) of -0.159 and weighted average of 64.2%, a difference of 4.9%.
In Labor Force | Age > 16 Correlation Summary
| Measurement | Immigrants from Africa | Basque |
| Minimum | 50.0% | 25.7% |
| Maximum | 95.6% | 85.4% |
| Range | 45.6% | 59.7% |
| Mean | 70.0% | 58.2% |
| Median | 69.4% | 60.1% |
| Interquartile 25% (IQ1) | 67.0% | 53.6% |
| Interquartile 75% (IQ3) | 72.6% | 64.7% |
| Interquartile Range (IQR) | 5.5% | 11.1% |
| Standard Deviation (Sample) | 6.6% | 10.6% |
| Standard Deviation (Population) | 6.6% | 10.5% |
Similar Demographics by In Labor Force | Age > 16
Demographics Similar to Immigrants from Africa by In Labor Force | Age > 16
In terms of in labor force | age > 16, the demographic groups most similar to Immigrants from Africa are Ugandan (67.4%, a difference of 0.030%), Immigrants from Cabo Verde (67.3%, a difference of 0.030%), Cambodian (67.4%, a difference of 0.090%), Zimbabwean (67.3%, a difference of 0.11%), and Immigrants from Morocco (67.2%, a difference of 0.19%).
| Demographics | Rating | Rank | In Labor Force | Age > 16 |
| Immigrants | Liberia | 100.0 /100 | #18 | Exceptional 67.6% |
| Kenyans | 100.0 /100 | #19 | Exceptional 67.6% |
| Immigrants | Kenya | 100.0 /100 | #20 | Exceptional 67.6% |
| Tongans | 100.0 /100 | #21 | Exceptional 67.5% |
| Immigrants | Uganda | 100.0 /100 | #22 | Exceptional 67.5% |
| Cambodians | 100.0 /100 | #23 | Exceptional 67.4% |
| Ugandans | 100.0 /100 | #24 | Exceptional 67.4% |
| Immigrants | Africa | 100.0 /100 | #25 | Exceptional 67.4% |
| Immigrants | Cabo Verde | 100.0 /100 | #26 | Exceptional 67.3% |
| Zimbabweans | 100.0 /100 | #27 | Exceptional 67.3% |
| Immigrants | Morocco | 100.0 /100 | #28 | Exceptional 67.2% |
| Thais | 100.0 /100 | #29 | Exceptional 67.2% |
| Immigrants | Zaire | 100.0 /100 | #30 | Exceptional 67.2% |
| Ghanaians | 100.0 /100 | #31 | Exceptional 67.1% |
| Immigrants | Congo | 100.0 /100 | #32 | Exceptional 67.1% |
Demographics Similar to Basques by In Labor Force | Age > 16
In terms of in labor force | age > 16, the demographic groups most similar to Basques are Marshallese (64.2%, a difference of 0.0%), Immigrants from Western Europe (64.2%, a difference of 0.010%), Finnish (64.2%, a difference of 0.010%), Bahamian (64.2%, a difference of 0.030%), and Immigrants from Scotland (64.2%, a difference of 0.040%).
| Demographics | Rating | Rank | In Labor Force | Age > 16 |
| Immigrants | Uzbekistan | 1.4 /100 | #254 | Tragic 64.3% |
| Hispanics or Latinos | 1.1 /100 | #255 | Tragic 64.3% |
| Immigrants | Mexico | 1.0 /100 | #256 | Tragic 64.3% |
| Inupiat | 0.8 /100 | #257 | Tragic 64.3% |
| Immigrants | Scotland | 0.8 /100 | #258 | Tragic 64.2% |
| Immigrants | Western Europe | 0.7 /100 | #259 | Tragic 64.2% |
| Marshallese | 0.7 /100 | #260 | Tragic 64.2% |
| Basques | 0.7 /100 | #261 | Tragic 64.2% |
| Finns | 0.7 /100 | #262 | Tragic 64.2% |
| Bahamians | 0.6 /100 | #263 | Tragic 64.2% |
| Dutch | 0.6 /100 | #264 | Tragic 64.2% |
| Cubans | 0.5 /100 | #265 | Tragic 64.2% |
| Immigrants | England | 0.5 /100 | #266 | Tragic 64.2% |
| Canadians | 0.5 /100 | #267 | Tragic 64.1% |
| Spaniards | 0.5 /100 | #268 | Tragic 64.1% |