Filipino vs Nonimmigrants In Labor Force | Age 45-54
COMPARE
Filipino
Nonimmigrants
In Labor Force | Age 45-54
In Labor Force | Age 45-54 Comparison
Filipinos
Nonimmigrants
83.5%
IN LABOR FORCE | AGE 45-54
98.3/ 100
METRIC RATING
61st/ 347
METRIC RANK
81.2%
IN LABOR FORCE | AGE 45-54
0.0/ 100
METRIC RATING
275th/ 347
METRIC RANK
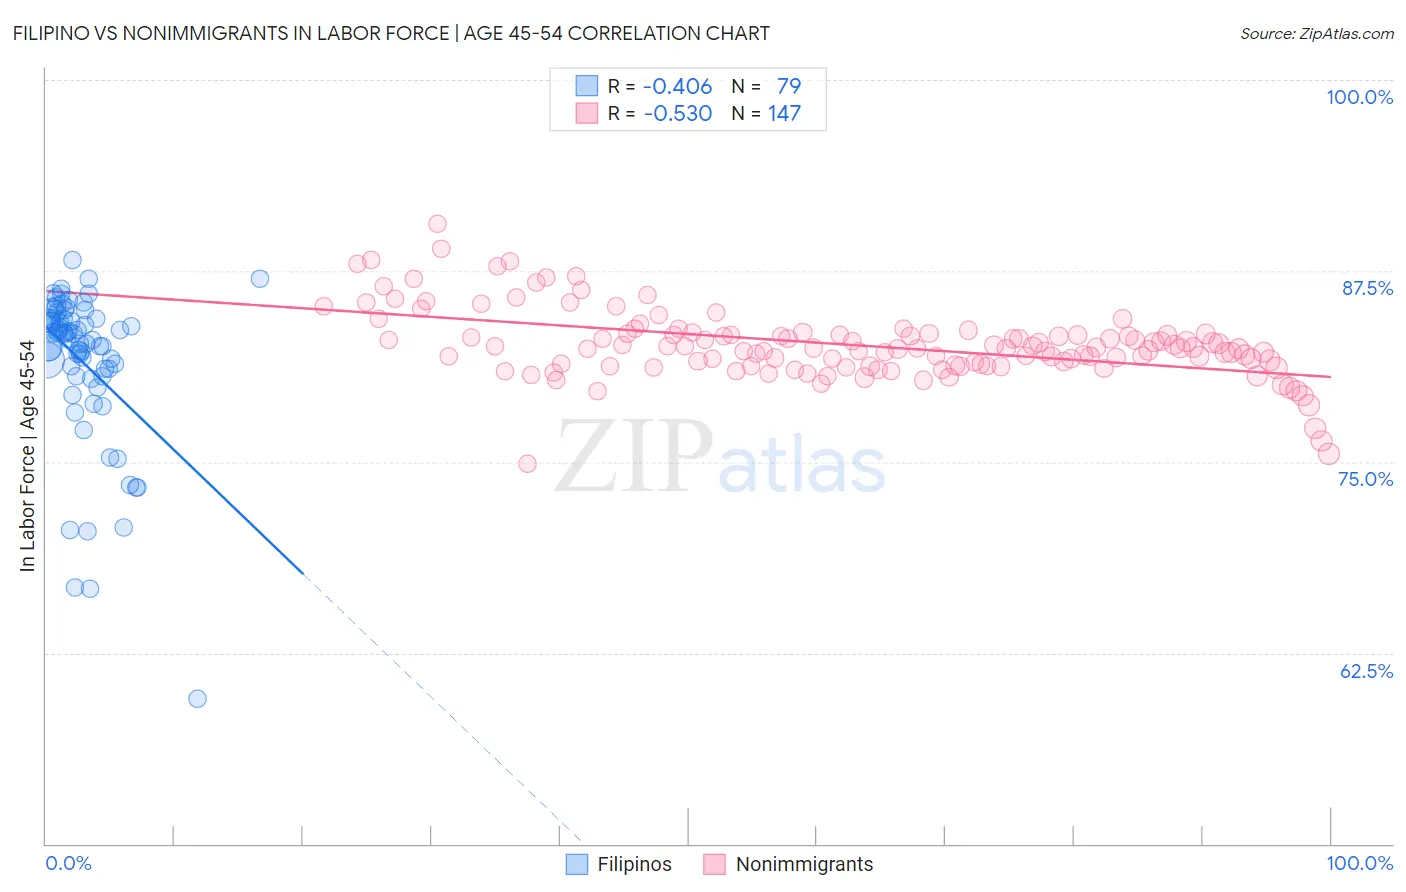
Filipino vs Nonimmigrants In Labor Force | Age 45-54 Correlation Chart
The statistical analysis conducted on geographies consisting of 254,168,663 people shows a moderate negative correlation between the proportion of Filipinos and labor force participation rate among population between the ages 45 and 54 in the United States with a correlation coefficient (R) of -0.406 and weighted average of 83.5%. Similarly, the statistical analysis conducted on geographies consisting of 584,054,768 people shows a substantial negative correlation between the proportion of Nonimmigrants and labor force participation rate among population between the ages 45 and 54 in the United States with a correlation coefficient (R) of -0.530 and weighted average of 81.2%, a difference of 2.8%.
In Labor Force | Age 45-54 Correlation Summary
| Measurement | Filipino | Nonimmigrants |
| Minimum | 59.5% | 74.9% |
| Maximum | 88.2% | 90.6% |
| Range | 28.7% | 15.7% |
| Mean | 81.5% | 82.6% |
| Median | 83.4% | 82.4% |
| Interquartile 25% (IQ1) | 80.6% | 81.3% |
| Interquartile 75% (IQ3) | 84.4% | 83.3% |
| Interquartile Range (IQR) | 3.8% | 2.1% |
| Standard Deviation (Sample) | 5.2% | 2.3% |
| Standard Deviation (Population) | 5.1% | 2.3% |
Similar Demographics by In Labor Force | Age 45-54
Demographics Similar to Filipinos by In Labor Force | Age 45-54
In terms of in labor force | age 45-54, the demographic groups most similar to Filipinos are Carpatho Rusyn (83.5%, a difference of 0.0%), Bhutanese (83.5%, a difference of 0.010%), Eastern European (83.5%, a difference of 0.020%), Paraguayan (83.5%, a difference of 0.030%), and Immigrants from Taiwan (83.5%, a difference of 0.030%).
| Demographics | Rating | Rank | In Labor Force | Age 45-54 |
| Somalis | 98.7 /100 | #54 | Exceptional 83.5% |
| Macedonians | 98.7 /100 | #55 | Exceptional 83.5% |
| Immigrants | Peru | 98.6 /100 | #56 | Exceptional 83.5% |
| Paraguayans | 98.5 /100 | #57 | Exceptional 83.5% |
| Eastern Europeans | 98.5 /100 | #58 | Exceptional 83.5% |
| Bhutanese | 98.3 /100 | #59 | Exceptional 83.5% |
| Carpatho Rusyns | 98.3 /100 | #60 | Exceptional 83.5% |
| Filipinos | 98.3 /100 | #61 | Exceptional 83.5% |
| Immigrants | Taiwan | 98.0 /100 | #62 | Exceptional 83.5% |
| Afghans | 97.9 /100 | #63 | Exceptional 83.5% |
| Immigrants | Kenya | 97.9 /100 | #64 | Exceptional 83.5% |
| Egyptians | 97.9 /100 | #65 | Exceptional 83.5% |
| Asians | 97.7 /100 | #66 | Exceptional 83.4% |
| Chileans | 97.7 /100 | #67 | Exceptional 83.4% |
| Immigrants | Colombia | 97.6 /100 | #68 | Exceptional 83.4% |
Demographics Similar to Nonimmigrants by In Labor Force | Age 45-54
In terms of in labor force | age 45-54, the demographic groups most similar to Nonimmigrants are British West Indian (81.2%, a difference of 0.010%), Chippewa (81.3%, a difference of 0.040%), U.S. Virgin Islander (81.2%, a difference of 0.040%), Guatemalan (81.2%, a difference of 0.060%), and Spanish (81.3%, a difference of 0.10%).
| Demographics | Rating | Rank | In Labor Force | Age 45-54 |
| Immigrants | Honduras | 0.0 /100 | #268 | Tragic 81.4% |
| Alsatians | 0.0 /100 | #269 | Tragic 81.3% |
| Bangladeshis | 0.0 /100 | #270 | Tragic 81.3% |
| Immigrants | Barbados | 0.0 /100 | #271 | Tragic 81.3% |
| Spanish | 0.0 /100 | #272 | Tragic 81.3% |
| Chippewa | 0.0 /100 | #273 | Tragic 81.3% |
| British West Indians | 0.0 /100 | #274 | Tragic 81.2% |
| Immigrants | Nonimmigrants | 0.0 /100 | #275 | Tragic 81.2% |
| U.S. Virgin Islanders | 0.0 /100 | #276 | Tragic 81.2% |
| Guatemalans | 0.0 /100 | #277 | Tragic 81.2% |
| Immigrants | Guatemala | 0.0 /100 | #278 | Tragic 81.1% |
| Immigrants | Micronesia | 0.0 /100 | #279 | Tragic 81.1% |
| Immigrants | Latin America | 0.0 /100 | #280 | Tragic 81.0% |
| Immigrants | Grenada | 0.0 /100 | #281 | Tragic 81.0% |
| Aleuts | 0.0 /100 | #282 | Tragic 81.0% |