Dominican vs Immigrants from Liberia In Labor Force | Age 20-24
COMPARE
Dominican
Immigrants from Liberia
In Labor Force | Age 20-24
In Labor Force | Age 20-24 Comparison
Dominicans
Immigrants from Liberia
71.1%
IN LABOR FORCE | AGE 20-24
0.0/ 100
METRIC RATING
326th/ 347
METRIC RANK
77.1%
IN LABOR FORCE | AGE 20-24
99.9/ 100
METRIC RATING
55th/ 347
METRIC RANK
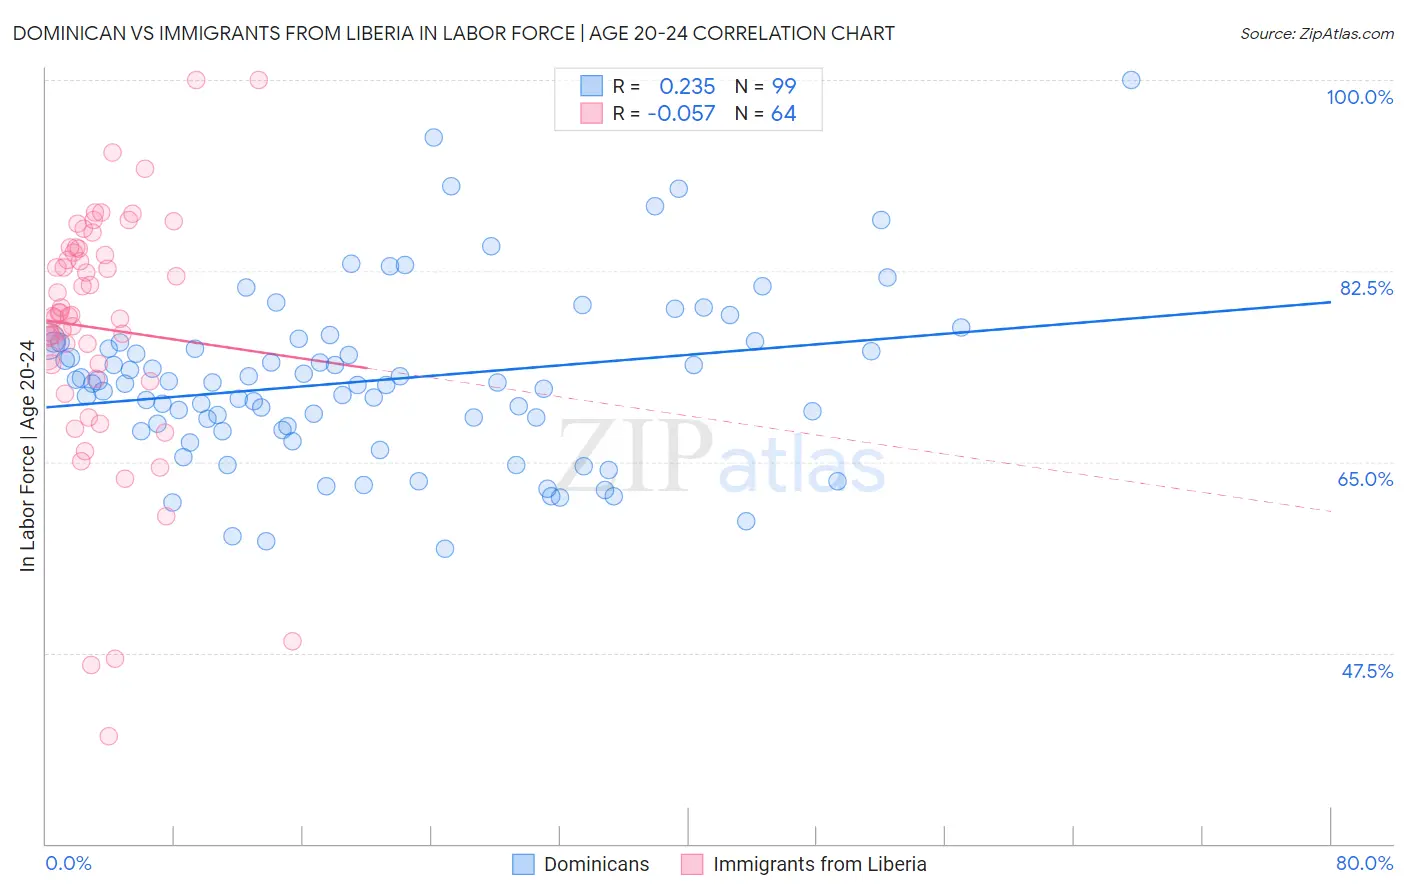
Dominican vs Immigrants from Liberia In Labor Force | Age 20-24 Correlation Chart
The statistical analysis conducted on geographies consisting of 355,092,394 people shows a weak positive correlation between the proportion of Dominicans and labor force participation rate among population between the ages 20 and 24 in the United States with a correlation coefficient (R) of 0.235 and weighted average of 71.1%. Similarly, the statistical analysis conducted on geographies consisting of 135,280,504 people shows a slight negative correlation between the proportion of Immigrants from Liberia and labor force participation rate among population between the ages 20 and 24 in the United States with a correlation coefficient (R) of -0.057 and weighted average of 77.1%, a difference of 8.5%.
In Labor Force | Age 20-24 Correlation Summary
| Measurement | Dominican | Immigrants from Liberia |
| Minimum | 57.1% | 39.8% |
| Maximum | 100.0% | 100.0% |
| Range | 42.9% | 60.2% |
| Mean | 72.4% | 77.3% |
| Median | 72.2% | 78.4% |
| Interquartile 25% (IQ1) | 67.9% | 73.3% |
| Interquartile 75% (IQ3) | 76.0% | 84.3% |
| Interquartile Range (IQR) | 8.1% | 11.1% |
| Standard Deviation (Sample) | 7.8% | 11.5% |
| Standard Deviation (Population) | 7.7% | 11.4% |
Similar Demographics by In Labor Force | Age 20-24
Demographics Similar to Dominicans by In Labor Force | Age 20-24
In terms of in labor force | age 20-24, the demographic groups most similar to Dominicans are Immigrants from Trinidad and Tobago (71.1%, a difference of 0.0%), Immigrants from China (71.1%, a difference of 0.020%), Barbadian (71.1%, a difference of 0.080%), Immigrants from Dominican Republic (71.2%, a difference of 0.19%), and Yup'ik (70.9%, a difference of 0.26%).
| Demographics | Rating | Rank | In Labor Force | Age 20-24 |
| Immigrants | Israel | 0.0 /100 | #319 | Tragic 71.6% |
| Trinidadians and Tobagonians | 0.0 /100 | #320 | Tragic 71.5% |
| Immigrants | Taiwan | 0.0 /100 | #321 | Tragic 71.5% |
| Filipinos | 0.0 /100 | #322 | Tragic 71.4% |
| West Indians | 0.0 /100 | #323 | Tragic 71.3% |
| Immigrants | Dominican Republic | 0.0 /100 | #324 | Tragic 71.2% |
| Barbadians | 0.0 /100 | #325 | Tragic 71.1% |
| Dominicans | 0.0 /100 | #326 | Tragic 71.1% |
| Immigrants | Trinidad and Tobago | 0.0 /100 | #327 | Tragic 71.1% |
| Immigrants | China | 0.0 /100 | #328 | Tragic 71.1% |
| Yup'ik | 0.0 /100 | #329 | Tragic 70.9% |
| Vietnamese | 0.0 /100 | #330 | Tragic 70.6% |
| Immigrants | Bangladesh | 0.0 /100 | #331 | Tragic 70.6% |
| Immigrants | Uzbekistan | 0.0 /100 | #332 | Tragic 70.4% |
| Yuman | 0.0 /100 | #333 | Tragic 70.3% |
Demographics Similar to Immigrants from Liberia by In Labor Force | Age 20-24
In terms of in labor force | age 20-24, the demographic groups most similar to Immigrants from Liberia are European (77.1%, a difference of 0.010%), Celtic (77.1%, a difference of 0.020%), Chippewa (77.1%, a difference of 0.020%), Hawaiian (77.0%, a difference of 0.040%), and Scotch-Irish (77.0%, a difference of 0.070%).
| Demographics | Rating | Rank | In Labor Force | Age 20-24 |
| Serbians | 100.0 /100 | #48 | Exceptional 77.3% |
| Chinese | 100.0 /100 | #49 | Exceptional 77.3% |
| Malaysians | 100.0 /100 | #50 | Exceptional 77.2% |
| Croatians | 100.0 /100 | #51 | Exceptional 77.2% |
| Indonesians | 100.0 /100 | #52 | Exceptional 77.2% |
| Immigrants | Azores | 100.0 /100 | #53 | Exceptional 77.2% |
| Celtics | 99.9 /100 | #54 | Exceptional 77.1% |
| Immigrants | Liberia | 99.9 /100 | #55 | Exceptional 77.1% |
| Europeans | 99.9 /100 | #56 | Exceptional 77.1% |
| Chippewa | 99.9 /100 | #57 | Exceptional 77.1% |
| Hawaiians | 99.9 /100 | #58 | Exceptional 77.0% |
| Scotch-Irish | 99.9 /100 | #59 | Exceptional 77.0% |
| Kenyans | 99.9 /100 | #60 | Exceptional 77.0% |
| Immigrants | Eritrea | 99.9 /100 | #61 | Exceptional 77.0% |
| Immigrants | Kenya | 99.9 /100 | #62 | Exceptional 77.0% |