Crow vs Liberian In Labor Force | Age 20-64
COMPARE
Crow
Liberian
In Labor Force | Age 20-64
In Labor Force | Age 20-64 Comparison
Crow
Liberians
73.3%
IN LABOR FORCE | AGE 20-64
0.0/ 100
METRIC RATING
336th/ 347
METRIC RANK
80.9%
IN LABOR FORCE | AGE 20-64
100.0/ 100
METRIC RATING
21st/ 347
METRIC RANK
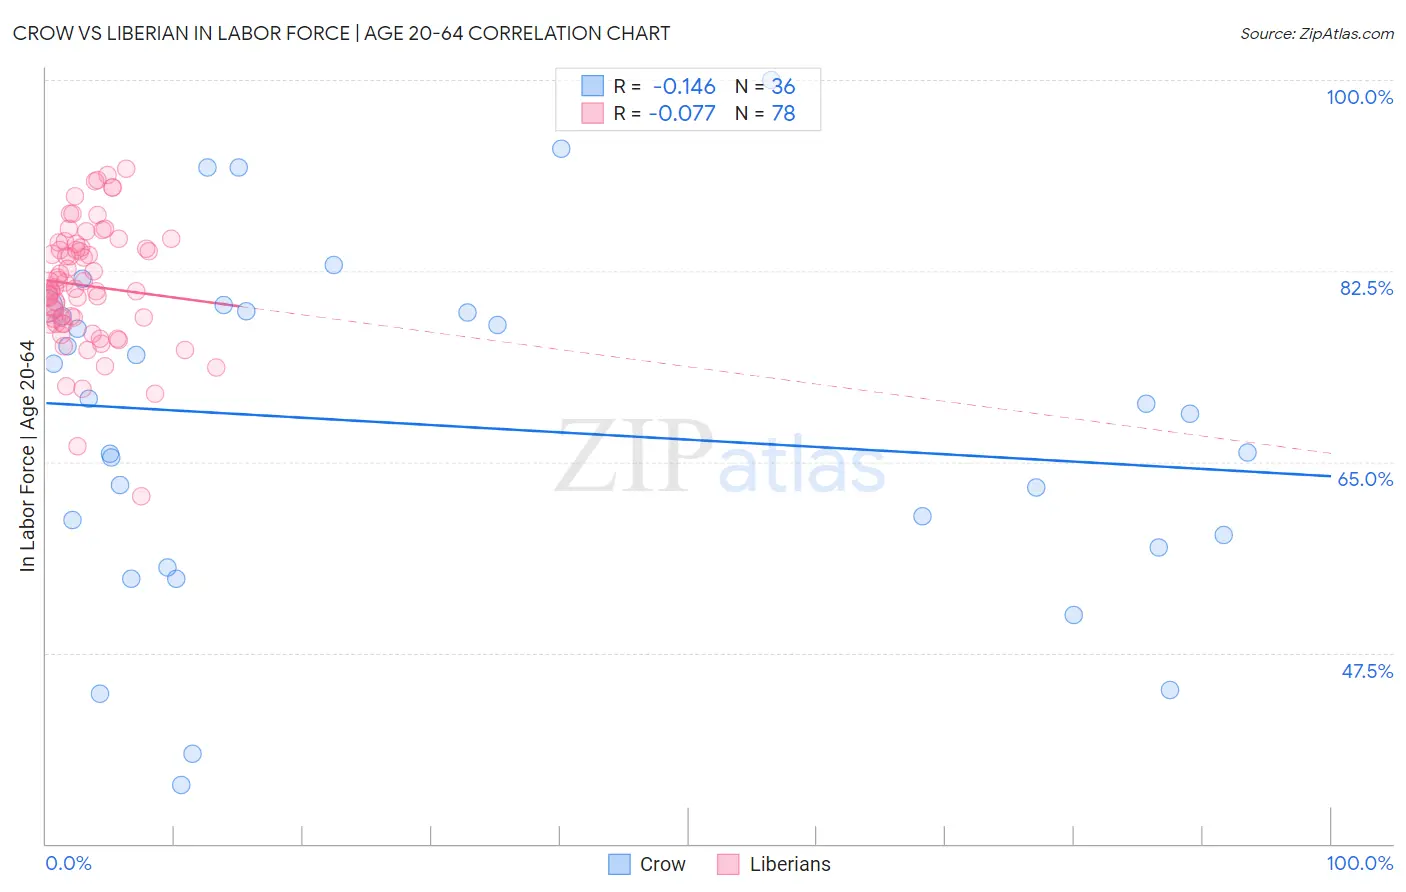
Crow vs Liberian In Labor Force | Age 20-64 Correlation Chart
The statistical analysis conducted on geographies consisting of 59,204,948 people shows a poor negative correlation between the proportion of Crow and labor force participation rate among population between the ages 20 and 64 in the United States with a correlation coefficient (R) of -0.146 and weighted average of 73.3%. Similarly, the statistical analysis conducted on geographies consisting of 118,097,222 people shows a slight negative correlation between the proportion of Liberians and labor force participation rate among population between the ages 20 and 64 in the United States with a correlation coefficient (R) of -0.077 and weighted average of 80.9%, a difference of 10.4%.
In Labor Force | Age 20-64 Correlation Summary
| Measurement | Crow | Liberian |
| Minimum | 35.4% | 61.8% |
| Maximum | 100.0% | 91.9% |
| Range | 64.6% | 30.1% |
| Mean | 68.3% | 81.1% |
| Median | 69.8% | 80.9% |
| Interquartile 25% (IQ1) | 57.7% | 77.7% |
| Interquartile 75% (IQ3) | 78.7% | 84.7% |
| Interquartile Range (IQR) | 21.0% | 7.0% |
| Standard Deviation (Sample) | 15.6% | 5.6% |
| Standard Deviation (Population) | 15.4% | 5.5% |
Similar Demographics by In Labor Force | Age 20-64
Demographics Similar to Crow by In Labor Force | Age 20-64
In terms of in labor force | age 20-64, the demographic groups most similar to Crow are Yup'ik (73.2%, a difference of 0.12%), Puerto Rican (73.1%, a difference of 0.32%), Ute (73.7%, a difference of 0.51%), Apache (73.7%, a difference of 0.52%), and Houma (72.7%, a difference of 0.76%).
| Demographics | Rating | Rank | In Labor Force | Age 20-64 |
| Cheyenne | 0.0 /100 | #329 | Tragic 74.8% |
| Colville | 0.0 /100 | #330 | Tragic 74.8% |
| Paiute | 0.0 /100 | #331 | Tragic 74.7% |
| Arapaho | 0.0 /100 | #332 | Tragic 74.4% |
| Natives/Alaskans | 0.0 /100 | #333 | Tragic 73.9% |
| Apache | 0.0 /100 | #334 | Tragic 73.7% |
| Ute | 0.0 /100 | #335 | Tragic 73.7% |
| Crow | 0.0 /100 | #336 | Tragic 73.3% |
| Yup'ik | 0.0 /100 | #337 | Tragic 73.2% |
| Puerto Ricans | 0.0 /100 | #338 | Tragic 73.1% |
| Houma | 0.0 /100 | #339 | Tragic 72.7% |
| Pueblo | 0.0 /100 | #340 | Tragic 72.6% |
| Immigrants | Yemen | 0.0 /100 | #341 | Tragic 72.3% |
| Yuman | 0.0 /100 | #342 | Tragic 71.7% |
| Hopi | 0.0 /100 | #343 | Tragic 71.7% |
Demographics Similar to Liberians by In Labor Force | Age 20-64
In terms of in labor force | age 20-64, the demographic groups most similar to Liberians are Thai (80.9%, a difference of 0.020%), Immigrants from Bulgaria (81.0%, a difference of 0.070%), Zimbabwean (81.0%, a difference of 0.070%), Sudanese (80.8%, a difference of 0.070%), and Norwegian (81.0%, a difference of 0.080%).
| Demographics | Rating | Rank | In Labor Force | Age 20-64 |
| Cambodians | 100.0 /100 | #14 | Exceptional 81.1% |
| Bulgarians | 100.0 /100 | #15 | Exceptional 81.1% |
| Immigrants | Nepal | 100.0 /100 | #16 | Exceptional 81.1% |
| Norwegians | 100.0 /100 | #17 | Exceptional 81.0% |
| Immigrants | Bulgaria | 100.0 /100 | #18 | Exceptional 81.0% |
| Zimbabweans | 100.0 /100 | #19 | Exceptional 81.0% |
| Thais | 100.0 /100 | #20 | Exceptional 80.9% |
| Liberians | 100.0 /100 | #21 | Exceptional 80.9% |
| Sudanese | 100.0 /100 | #22 | Exceptional 80.8% |
| Immigrants | Bosnia and Herzegovina | 100.0 /100 | #23 | Exceptional 80.8% |
| Immigrants | Morocco | 100.0 /100 | #24 | Exceptional 80.8% |
| Kenyans | 100.0 /100 | #25 | Exceptional 80.8% |
| Immigrants | Serbia | 100.0 /100 | #26 | Exceptional 80.8% |
| Immigrants | Kenya | 99.9 /100 | #27 | Exceptional 80.7% |
| Immigrants | Uganda | 99.9 /100 | #28 | Exceptional 80.7% |