Colombian vs Taiwanese In Labor Force | Age 45-54
COMPARE
Colombian
Taiwanese
In Labor Force | Age 45-54
In Labor Force | Age 45-54 Comparison
Colombians
Taiwanese
83.4%
IN LABOR FORCE | AGE 45-54
97.3/ 100
METRIC RATING
71st/ 347
METRIC RANK
83.4%
IN LABOR FORCE | AGE 45-54
97.5/ 100
METRIC RATING
69th/ 347
METRIC RANK
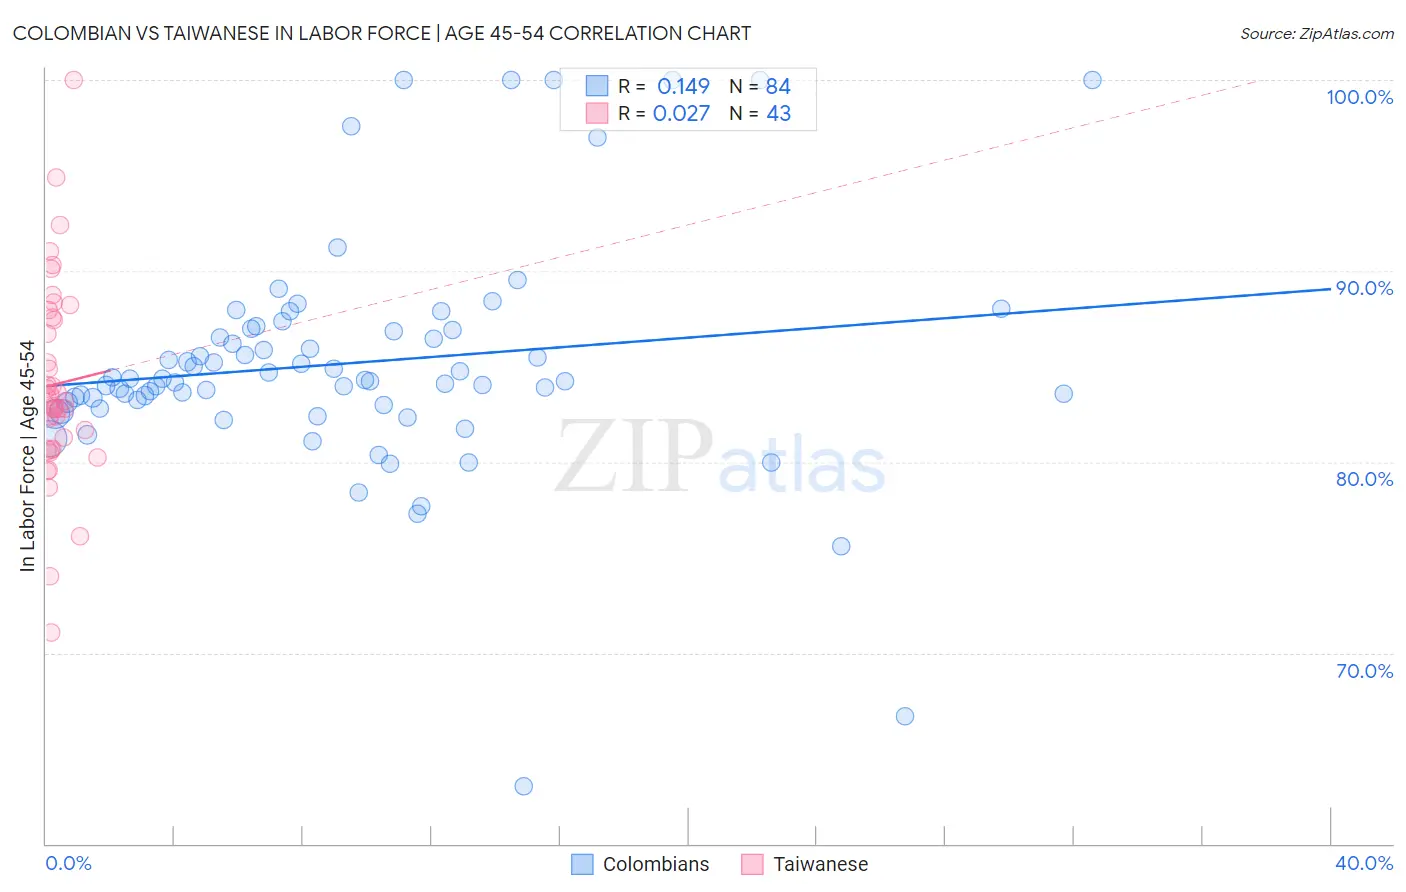
Colombian vs Taiwanese In Labor Force | Age 45-54 Correlation Chart
The statistical analysis conducted on geographies consisting of 419,305,643 people shows a poor positive correlation between the proportion of Colombians and labor force participation rate among population between the ages 45 and 54 in the United States with a correlation coefficient (R) of 0.149 and weighted average of 83.4%. Similarly, the statistical analysis conducted on geographies consisting of 31,713,651 people shows no correlation between the proportion of Taiwanese and labor force participation rate among population between the ages 45 and 54 in the United States with a correlation coefficient (R) of 0.027 and weighted average of 83.4%, a difference of 0.010%.
In Labor Force | Age 45-54 Correlation Summary
| Measurement | Colombian | Taiwanese |
| Minimum | 63.0% | 71.1% |
| Maximum | 100.0% | 100.0% |
| Range | 37.0% | 28.9% |
| Mean | 85.2% | 84.1% |
| Median | 84.3% | 83.2% |
| Interquartile 25% (IQ1) | 83.0% | 80.7% |
| Interquartile 75% (IQ3) | 86.9% | 87.6% |
| Interquartile Range (IQR) | 3.9% | 6.9% |
| Standard Deviation (Sample) | 6.1% | 5.3% |
| Standard Deviation (Population) | 6.1% | 5.2% |
Demographics Similar to Colombians and Taiwanese by In Labor Force | Age 45-54
In terms of in labor force | age 45-54, the demographic groups most similar to Colombians are Immigrants from Latvia (83.4%, a difference of 0.0%), Immigrants from Colombia (83.4%, a difference of 0.020%), Serbian (83.4%, a difference of 0.020%), Immigrants from Czechoslovakia (83.4%, a difference of 0.020%), and Chilean (83.4%, a difference of 0.030%). Similarly, the demographic groups most similar to Taiwanese are Immigrants from Colombia (83.4%, a difference of 0.010%), Immigrants from Latvia (83.4%, a difference of 0.010%), Asian (83.4%, a difference of 0.020%), Chilean (83.4%, a difference of 0.020%), and Serbian (83.4%, a difference of 0.030%).
| Demographics | Rating | Rank | In Labor Force | Age 45-54 |
| Carpatho Rusyns | 98.3 /100 | #60 | Exceptional 83.5% |
| Filipinos | 98.3 /100 | #61 | Exceptional 83.5% |
| Immigrants | Taiwan | 98.0 /100 | #62 | Exceptional 83.5% |
| Afghans | 97.9 /100 | #63 | Exceptional 83.5% |
| Immigrants | Kenya | 97.9 /100 | #64 | Exceptional 83.5% |
| Egyptians | 97.9 /100 | #65 | Exceptional 83.5% |
| Asians | 97.7 /100 | #66 | Exceptional 83.4% |
| Chileans | 97.7 /100 | #67 | Exceptional 83.4% |
| Immigrants | Colombia | 97.6 /100 | #68 | Exceptional 83.4% |
| Taiwanese | 97.5 /100 | #69 | Exceptional 83.4% |
| Immigrants | Latvia | 97.4 /100 | #70 | Exceptional 83.4% |
| Colombians | 97.3 /100 | #71 | Exceptional 83.4% |
| Serbians | 97.2 /100 | #72 | Exceptional 83.4% |
| Immigrants | Czechoslovakia | 97.1 /100 | #73 | Exceptional 83.4% |
| Immigrants | Somalia | 96.9 /100 | #74 | Exceptional 83.4% |
| Estonians | 96.9 /100 | #75 | Exceptional 83.4% |
| Russians | 96.8 /100 | #76 | Exceptional 83.4% |
| Cubans | 96.7 /100 | #77 | Exceptional 83.4% |
| Immigrants | Egypt | 96.6 /100 | #78 | Exceptional 83.4% |
| Belgians | 96.5 /100 | #79 | Exceptional 83.4% |
| Immigrants | Croatia | 96.5 /100 | #80 | Exceptional 83.4% |