Chilean vs Icelander In Labor Force | Age 35-44
COMPARE
Chilean
Icelander
In Labor Force | Age 35-44
In Labor Force | Age 35-44 Comparison
Chileans
Icelanders
84.7%
IN LABOR FORCE | AGE 35-44
93.2/ 100
METRIC RATING
114th/ 347
METRIC RANK
84.0%
IN LABOR FORCE | AGE 35-44
6.7/ 100
METRIC RATING
221st/ 347
METRIC RANK
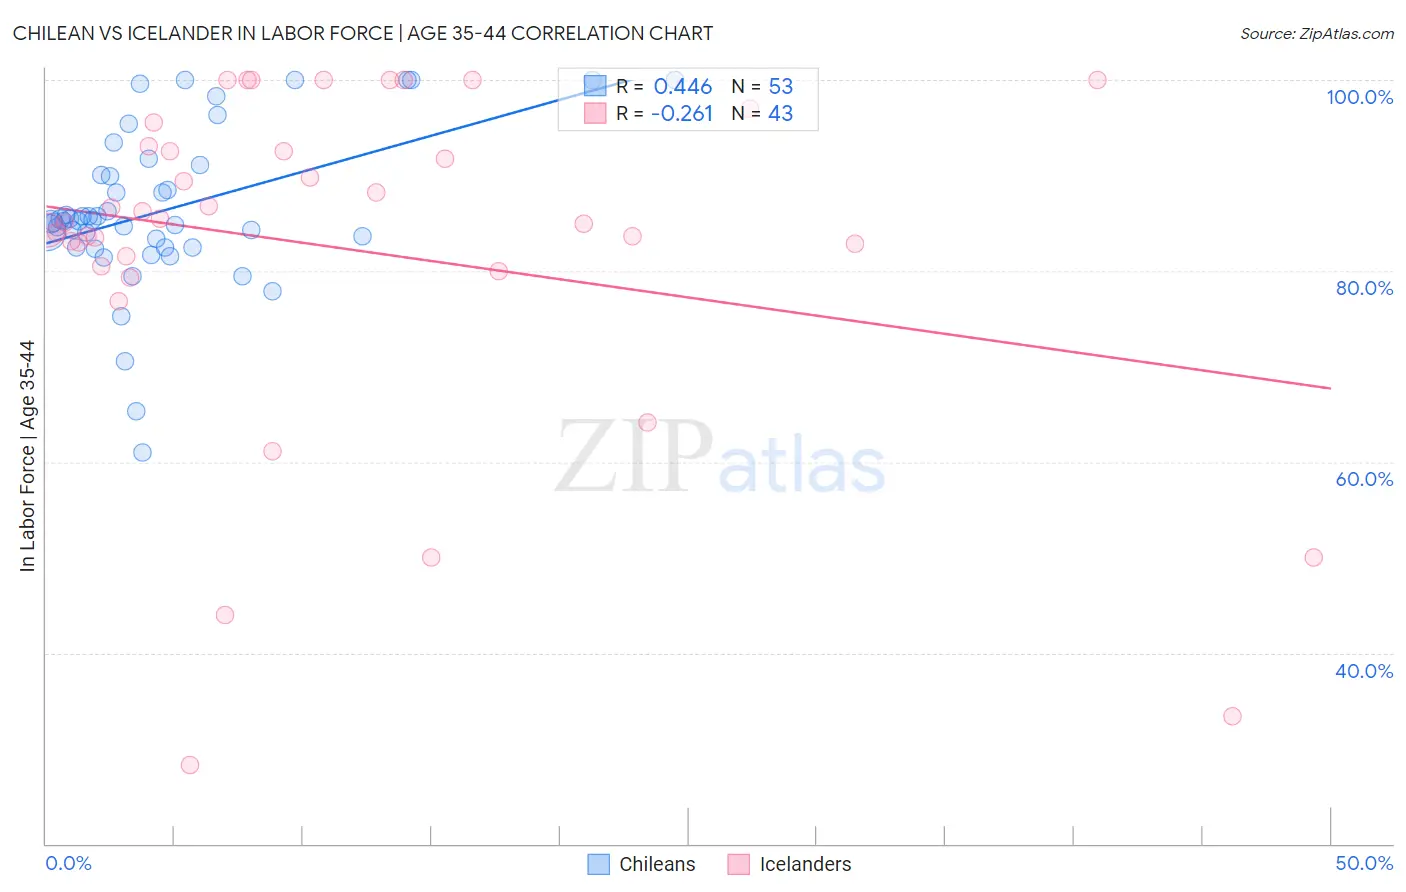
Chilean vs Icelander In Labor Force | Age 35-44 Correlation Chart
The statistical analysis conducted on geographies consisting of 256,599,929 people shows a moderate positive correlation between the proportion of Chileans and labor force participation rate among population between the ages 35 and 44 in the United States with a correlation coefficient (R) of 0.446 and weighted average of 84.7%. Similarly, the statistical analysis conducted on geographies consisting of 159,631,380 people shows a weak negative correlation between the proportion of Icelanders and labor force participation rate among population between the ages 35 and 44 in the United States with a correlation coefficient (R) of -0.261 and weighted average of 84.0%, a difference of 0.85%.
In Labor Force | Age 35-44 Correlation Summary
| Measurement | Chilean | Icelander |
| Minimum | 61.0% | 28.2% |
| Maximum | 100.0% | 100.0% |
| Range | 39.0% | 71.8% |
| Mean | 86.4% | 82.4% |
| Median | 85.2% | 85.1% |
| Interquartile 25% (IQ1) | 82.5% | 80.4% |
| Interquartile 75% (IQ3) | 90.5% | 93.1% |
| Interquartile Range (IQR) | 8.1% | 12.7% |
| Standard Deviation (Sample) | 8.3% | 17.8% |
| Standard Deviation (Population) | 8.2% | 17.6% |
Similar Demographics by In Labor Force | Age 35-44
Demographics Similar to Chileans by In Labor Force | Age 35-44
In terms of in labor force | age 35-44, the demographic groups most similar to Chileans are Immigrants from Western Africa (84.7%, a difference of 0.0%), Uruguayan (84.7%, a difference of 0.0%), Bahamian (84.7%, a difference of 0.0%), Filipino (84.7%, a difference of 0.010%), and Ukrainian (84.7%, a difference of 0.010%).
| Demographics | Rating | Rank | In Labor Force | Age 35-44 |
| Immigrants | Romania | 94.7 /100 | #107 | Exceptional 84.8% |
| Immigrants | Argentina | 94.5 /100 | #108 | Exceptional 84.8% |
| Immigrants | Russia | 94.5 /100 | #109 | Exceptional 84.8% |
| Filipinos | 93.8 /100 | #110 | Exceptional 84.7% |
| Ukrainians | 93.5 /100 | #111 | Exceptional 84.7% |
| Immigrants | Western Africa | 93.4 /100 | #112 | Exceptional 84.7% |
| Uruguayans | 93.3 /100 | #113 | Exceptional 84.7% |
| Chileans | 93.2 /100 | #114 | Exceptional 84.7% |
| Bahamians | 93.2 /100 | #115 | Exceptional 84.7% |
| Immigrants | Egypt | 92.7 /100 | #116 | Exceptional 84.7% |
| Immigrants | China | 92.3 /100 | #117 | Exceptional 84.7% |
| Immigrants | Eastern Asia | 92.1 /100 | #118 | Exceptional 84.7% |
| Burmese | 91.8 /100 | #119 | Exceptional 84.7% |
| Immigrants | Northern Europe | 91.5 /100 | #120 | Exceptional 84.7% |
| Finns | 91.2 /100 | #121 | Exceptional 84.7% |
Demographics Similar to Icelanders by In Labor Force | Age 35-44
In terms of in labor force | age 35-44, the demographic groups most similar to Icelanders are Assyrian/Chaldean/Syriac (84.0%, a difference of 0.0%), Immigrants from Panama (84.0%, a difference of 0.010%), French (84.0%, a difference of 0.020%), U.S. Virgin Islander (84.0%, a difference of 0.020%), and Immigrants from Burma/Myanmar (84.0%, a difference of 0.020%).
| Demographics | Rating | Rank | In Labor Force | Age 35-44 |
| Immigrants | Barbados | 13.2 /100 | #214 | Poor 84.1% |
| Europeans | 12.2 /100 | #215 | Poor 84.1% |
| Nicaraguans | 12.1 /100 | #216 | Poor 84.1% |
| Immigrants | Norway | 11.7 /100 | #217 | Poor 84.1% |
| Immigrants | Nicaragua | 9.4 /100 | #218 | Tragic 84.1% |
| Sub-Saharan Africans | 9.3 /100 | #219 | Tragic 84.1% |
| French | 7.5 /100 | #220 | Tragic 84.0% |
| Icelanders | 6.7 /100 | #221 | Tragic 84.0% |
| Assyrians/Chaldeans/Syriacs | 6.6 /100 | #222 | Tragic 84.0% |
| Immigrants | Panama | 6.4 /100 | #223 | Tragic 84.0% |
| U.S. Virgin Islanders | 6.1 /100 | #224 | Tragic 84.0% |
| Immigrants | Burma/Myanmar | 6.1 /100 | #225 | Tragic 84.0% |
| Panamanians | 5.4 /100 | #226 | Tragic 84.0% |
| British West Indians | 5.3 /100 | #227 | Tragic 84.0% |
| Welsh | 5.3 /100 | #228 | Tragic 84.0% |