Central American vs Immigrants from Uruguay In Labor Force | Age 45-54
COMPARE
Central American
Immigrants from Uruguay
In Labor Force | Age 45-54
In Labor Force | Age 45-54 Comparison
Central Americans
Immigrants from Uruguay
81.7%
IN LABOR FORCE | AGE 45-54
0.4/ 100
METRIC RATING
247th/ 347
METRIC RANK
83.2%
IN LABOR FORCE | AGE 45-54
90.2/ 100
METRIC RATING
119th/ 347
METRIC RANK
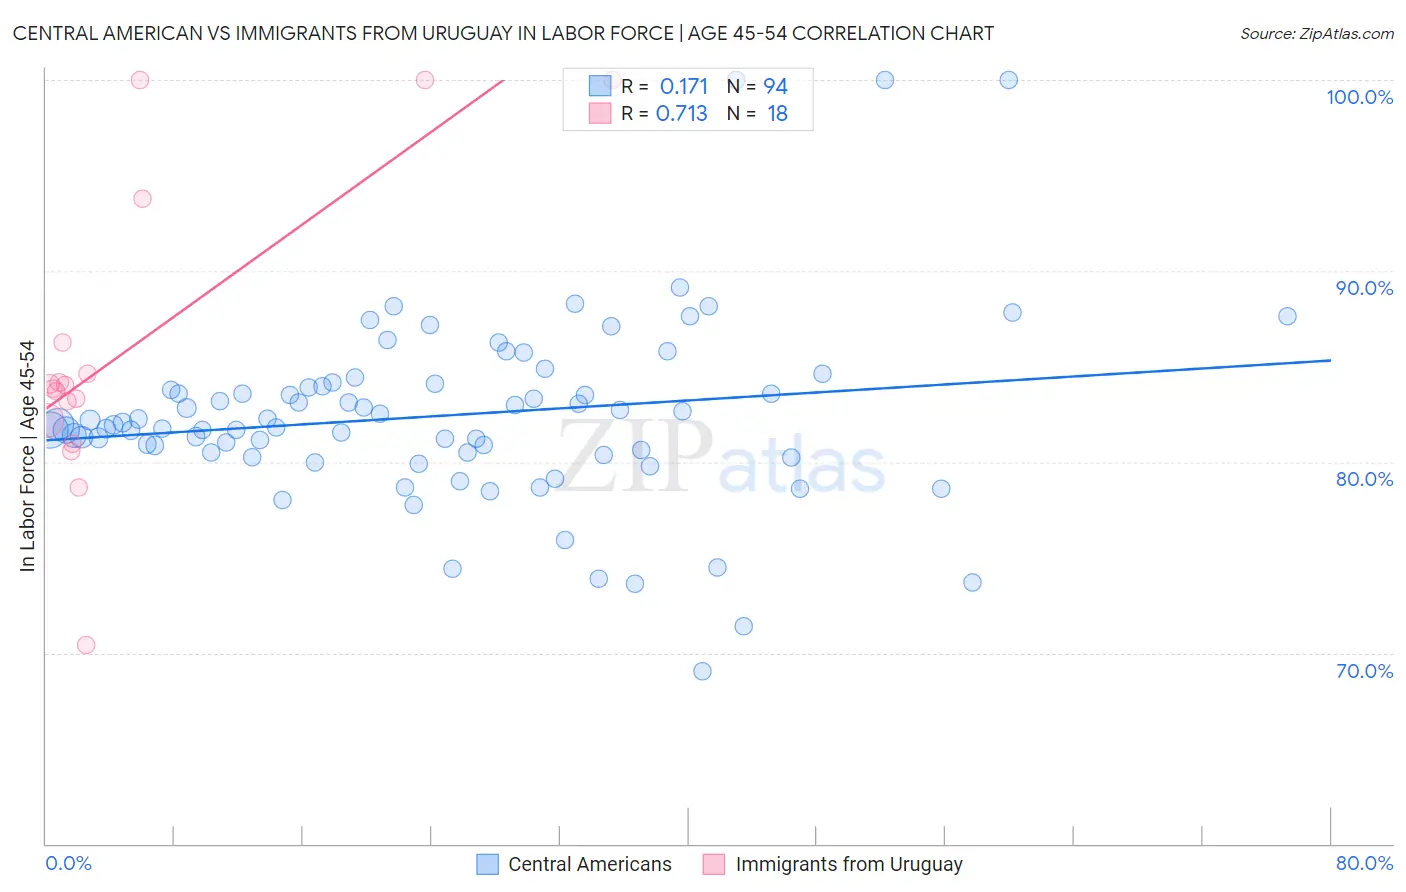
Central American vs Immigrants from Uruguay In Labor Force | Age 45-54 Correlation Chart
The statistical analysis conducted on geographies consisting of 504,028,701 people shows a poor positive correlation between the proportion of Central Americans and labor force participation rate among population between the ages 45 and 54 in the United States with a correlation coefficient (R) of 0.171 and weighted average of 81.7%. Similarly, the statistical analysis conducted on geographies consisting of 133,245,142 people shows a strong positive correlation between the proportion of Immigrants from Uruguay and labor force participation rate among population between the ages 45 and 54 in the United States with a correlation coefficient (R) of 0.713 and weighted average of 83.2%, a difference of 1.7%.
In Labor Force | Age 45-54 Correlation Summary
| Measurement | Central American | Immigrants from Uruguay |
| Minimum | 69.0% | 70.4% |
| Maximum | 100.0% | 100.0% |
| Range | 31.0% | 29.6% |
| Mean | 82.4% | 85.8% |
| Median | 82.0% | 83.9% |
| Interquartile 25% (IQ1) | 80.5% | 82.2% |
| Interquartile 75% (IQ3) | 84.0% | 86.2% |
| Interquartile Range (IQR) | 3.5% | 4.1% |
| Standard Deviation (Sample) | 4.9% | 7.9% |
| Standard Deviation (Population) | 4.9% | 7.6% |
Similar Demographics by In Labor Force | Age 45-54
Demographics Similar to Central Americans by In Labor Force | Age 45-54
In terms of in labor force | age 45-54, the demographic groups most similar to Central Americans are Alaska Native (81.8%, a difference of 0.020%), Alaskan Athabascan (81.8%, a difference of 0.020%), Puget Sound Salish (81.7%, a difference of 0.020%), Celtic (81.8%, a difference of 0.040%), and Hmong (81.7%, a difference of 0.040%).
| Demographics | Rating | Rank | In Labor Force | Age 45-54 |
| Immigrants | El Salvador | 1.0 /100 | #240 | Tragic 81.9% |
| Immigrants | Cambodia | 0.8 /100 | #241 | Tragic 81.9% |
| Whites/Caucasians | 0.7 /100 | #242 | Tragic 81.9% |
| Samoans | 0.6 /100 | #243 | Tragic 81.8% |
| Celtics | 0.4 /100 | #244 | Tragic 81.8% |
| Alaska Natives | 0.4 /100 | #245 | Tragic 81.8% |
| Alaskan Athabascans | 0.4 /100 | #246 | Tragic 81.8% |
| Central Americans | 0.4 /100 | #247 | Tragic 81.7% |
| Puget Sound Salish | 0.3 /100 | #248 | Tragic 81.7% |
| Hmong | 0.3 /100 | #249 | Tragic 81.7% |
| Immigrants | Armenia | 0.2 /100 | #250 | Tragic 81.7% |
| Guamanians/Chamorros | 0.2 /100 | #251 | Tragic 81.6% |
| Pennsylvania Germans | 0.2 /100 | #252 | Tragic 81.6% |
| Japanese | 0.2 /100 | #253 | Tragic 81.6% |
| Immigrants | Laos | 0.2 /100 | #254 | Tragic 81.6% |
Demographics Similar to Immigrants from Uruguay by In Labor Force | Age 45-54
In terms of in labor force | age 45-54, the demographic groups most similar to Immigrants from Uruguay are Immigrants from Russia (83.2%, a difference of 0.0%), Immigrants from Europe (83.2%, a difference of 0.010%), Immigrants from China (83.2%, a difference of 0.020%), Uruguayan (83.1%, a difference of 0.020%), and Immigrants from Malaysia (83.2%, a difference of 0.030%).
| Demographics | Rating | Rank | In Labor Force | Age 45-54 |
| Immigrants | Afghanistan | 92.4 /100 | #112 | Exceptional 83.2% |
| Immigrants | Albania | 91.8 /100 | #113 | Exceptional 83.2% |
| Assyrians/Chaldeans/Syriacs | 91.7 /100 | #114 | Exceptional 83.2% |
| Immigrants | Chile | 91.6 /100 | #115 | Exceptional 83.2% |
| Immigrants | Malaysia | 91.4 /100 | #116 | Exceptional 83.2% |
| Immigrants | China | 90.9 /100 | #117 | Exceptional 83.2% |
| Immigrants | Europe | 90.7 /100 | #118 | Exceptional 83.2% |
| Immigrants | Uruguay | 90.2 /100 | #119 | Exceptional 83.2% |
| Immigrants | Russia | 90.1 /100 | #120 | Exceptional 83.2% |
| Uruguayans | 89.4 /100 | #121 | Excellent 83.1% |
| Immigrants | Vietnam | 88.9 /100 | #122 | Excellent 83.1% |
| Tongans | 88.2 /100 | #123 | Excellent 83.1% |
| Bermudans | 88.0 /100 | #124 | Excellent 83.1% |
| Immigrants | Iran | 87.2 /100 | #125 | Excellent 83.1% |
| Immigrants | Belgium | 86.4 /100 | #126 | Excellent 83.1% |