Immigrants from Western Asia vs Immigrants from Uruguay In Labor Force | Age 45-54
COMPARE
Immigrants from Western Asia
Immigrants from Uruguay
In Labor Force | Age 45-54
In Labor Force | Age 45-54 Comparison
Immigrants from Western Asia
Immigrants from Uruguay
82.4%
IN LABOR FORCE | AGE 45-54
14.9/ 100
METRIC RATING
202nd/ 347
METRIC RANK
83.2%
IN LABOR FORCE | AGE 45-54
90.2/ 100
METRIC RATING
119th/ 347
METRIC RANK
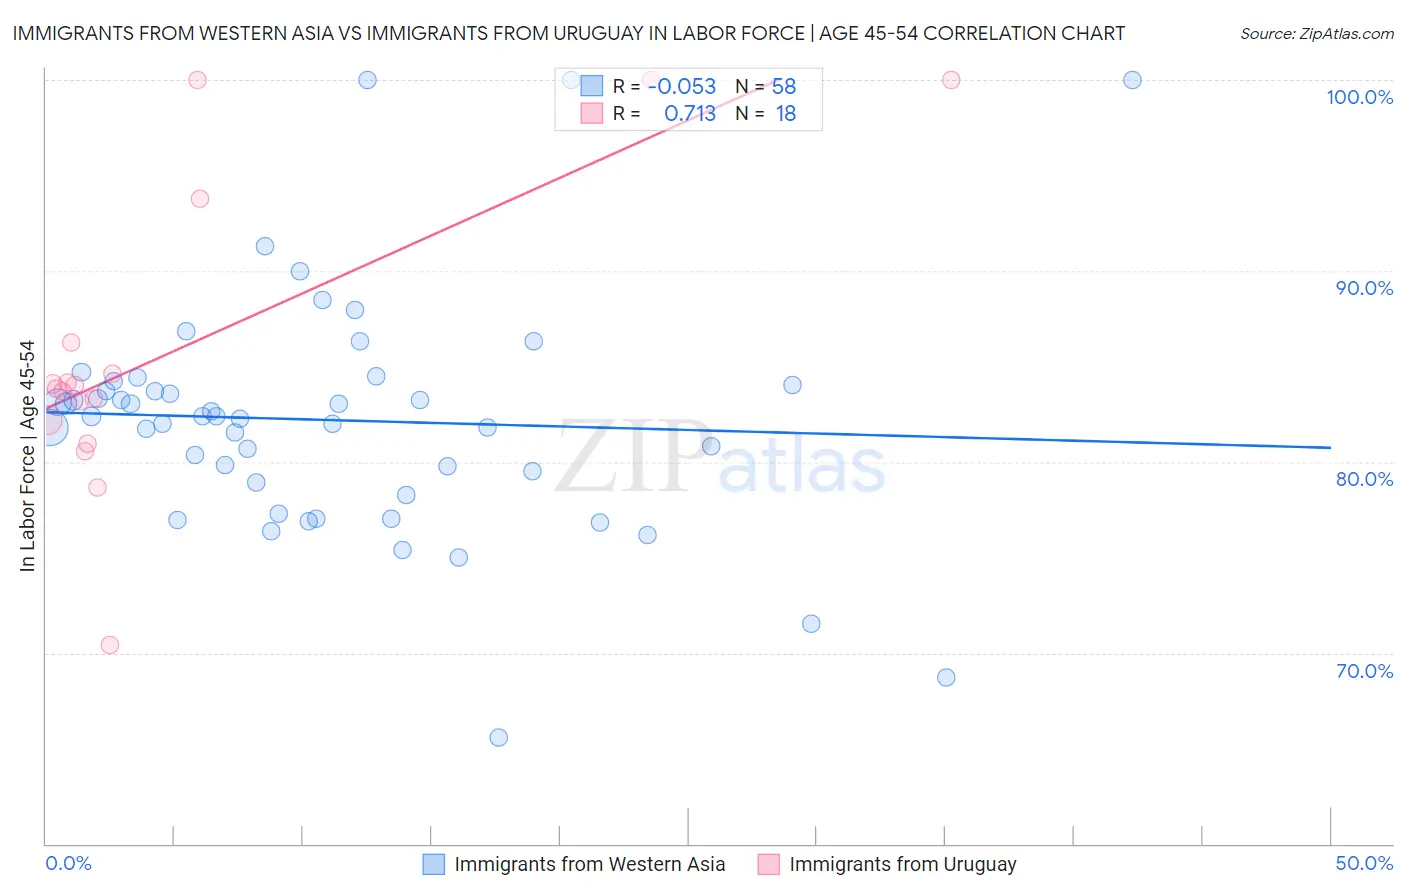
Immigrants from Western Asia vs Immigrants from Uruguay In Labor Force | Age 45-54 Correlation Chart
The statistical analysis conducted on geographies consisting of 404,107,591 people shows a slight negative correlation between the proportion of Immigrants from Western Asia and labor force participation rate among population between the ages 45 and 54 in the United States with a correlation coefficient (R) of -0.053 and weighted average of 82.4%. Similarly, the statistical analysis conducted on geographies consisting of 133,245,142 people shows a strong positive correlation between the proportion of Immigrants from Uruguay and labor force participation rate among population between the ages 45 and 54 in the United States with a correlation coefficient (R) of 0.713 and weighted average of 83.2%, a difference of 0.88%.
In Labor Force | Age 45-54 Correlation Summary
| Measurement | Immigrants from Western Asia | Immigrants from Uruguay |
| Minimum | 65.6% | 70.4% |
| Maximum | 100.0% | 100.0% |
| Range | 34.4% | 29.6% |
| Mean | 82.2% | 85.8% |
| Median | 82.4% | 83.9% |
| Interquartile 25% (IQ1) | 78.9% | 82.2% |
| Interquartile 75% (IQ3) | 84.0% | 86.2% |
| Interquartile Range (IQR) | 5.1% | 4.1% |
| Standard Deviation (Sample) | 6.2% | 7.9% |
| Standard Deviation (Population) | 6.2% | 7.6% |
Similar Demographics by In Labor Force | Age 45-54
Demographics Similar to Immigrants from Western Asia by In Labor Force | Age 45-54
In terms of in labor force | age 45-54, the demographic groups most similar to Immigrants from Western Asia are Canadian (82.4%, a difference of 0.0%), Moroccan (82.5%, a difference of 0.010%), French Canadian (82.5%, a difference of 0.010%), Lebanese (82.5%, a difference of 0.050%), and Immigrants from Denmark (82.5%, a difference of 0.050%).
| Demographics | Rating | Rank | In Labor Force | Age 45-54 |
| Immigrants | Canada | 20.0 /100 | #195 | Fair 82.5% |
| Immigrants | North America | 18.8 /100 | #196 | Poor 82.5% |
| Lebanese | 18.2 /100 | #197 | Poor 82.5% |
| Immigrants | Denmark | 17.9 /100 | #198 | Poor 82.5% |
| Moroccans | 15.7 /100 | #199 | Poor 82.5% |
| French Canadians | 15.4 /100 | #200 | Poor 82.5% |
| Canadians | 15.1 /100 | #201 | Poor 82.4% |
| Immigrants | Western Asia | 14.9 /100 | #202 | Poor 82.4% |
| Arabs | 11.6 /100 | #203 | Poor 82.4% |
| Immigrants | Western Europe | 10.9 /100 | #204 | Poor 82.4% |
| Senegalese | 9.5 /100 | #205 | Tragic 82.4% |
| Welsh | 9.2 /100 | #206 | Tragic 82.3% |
| Immigrants | Cabo Verde | 8.6 /100 | #207 | Tragic 82.3% |
| Native Hawaiians | 8.5 /100 | #208 | Tragic 82.3% |
| Immigrants | Lebanon | 7.4 /100 | #209 | Tragic 82.3% |
Demographics Similar to Immigrants from Uruguay by In Labor Force | Age 45-54
In terms of in labor force | age 45-54, the demographic groups most similar to Immigrants from Uruguay are Immigrants from Russia (83.2%, a difference of 0.0%), Immigrants from Europe (83.2%, a difference of 0.010%), Immigrants from China (83.2%, a difference of 0.020%), Uruguayan (83.1%, a difference of 0.020%), and Immigrants from Malaysia (83.2%, a difference of 0.030%).
| Demographics | Rating | Rank | In Labor Force | Age 45-54 |
| Immigrants | Afghanistan | 92.4 /100 | #112 | Exceptional 83.2% |
| Immigrants | Albania | 91.8 /100 | #113 | Exceptional 83.2% |
| Assyrians/Chaldeans/Syriacs | 91.7 /100 | #114 | Exceptional 83.2% |
| Immigrants | Chile | 91.6 /100 | #115 | Exceptional 83.2% |
| Immigrants | Malaysia | 91.4 /100 | #116 | Exceptional 83.2% |
| Immigrants | China | 90.9 /100 | #117 | Exceptional 83.2% |
| Immigrants | Europe | 90.7 /100 | #118 | Exceptional 83.2% |
| Immigrants | Uruguay | 90.2 /100 | #119 | Exceptional 83.2% |
| Immigrants | Russia | 90.1 /100 | #120 | Exceptional 83.2% |
| Uruguayans | 89.4 /100 | #121 | Excellent 83.1% |
| Immigrants | Vietnam | 88.9 /100 | #122 | Excellent 83.1% |
| Tongans | 88.2 /100 | #123 | Excellent 83.1% |
| Bermudans | 88.0 /100 | #124 | Excellent 83.1% |
| Immigrants | Iran | 87.2 /100 | #125 | Excellent 83.1% |
| Immigrants | Belgium | 86.4 /100 | #126 | Excellent 83.1% |