Central American vs Cambodian In Labor Force | Age 45-54
COMPARE
Central American
Cambodian
In Labor Force | Age 45-54
In Labor Force | Age 45-54 Comparison
Central Americans
Cambodians
81.7%
IN LABOR FORCE | AGE 45-54
0.4/ 100
METRIC RATING
247th/ 347
METRIC RANK
84.1%
IN LABOR FORCE | AGE 45-54
99.9/ 100
METRIC RATING
14th/ 347
METRIC RANK
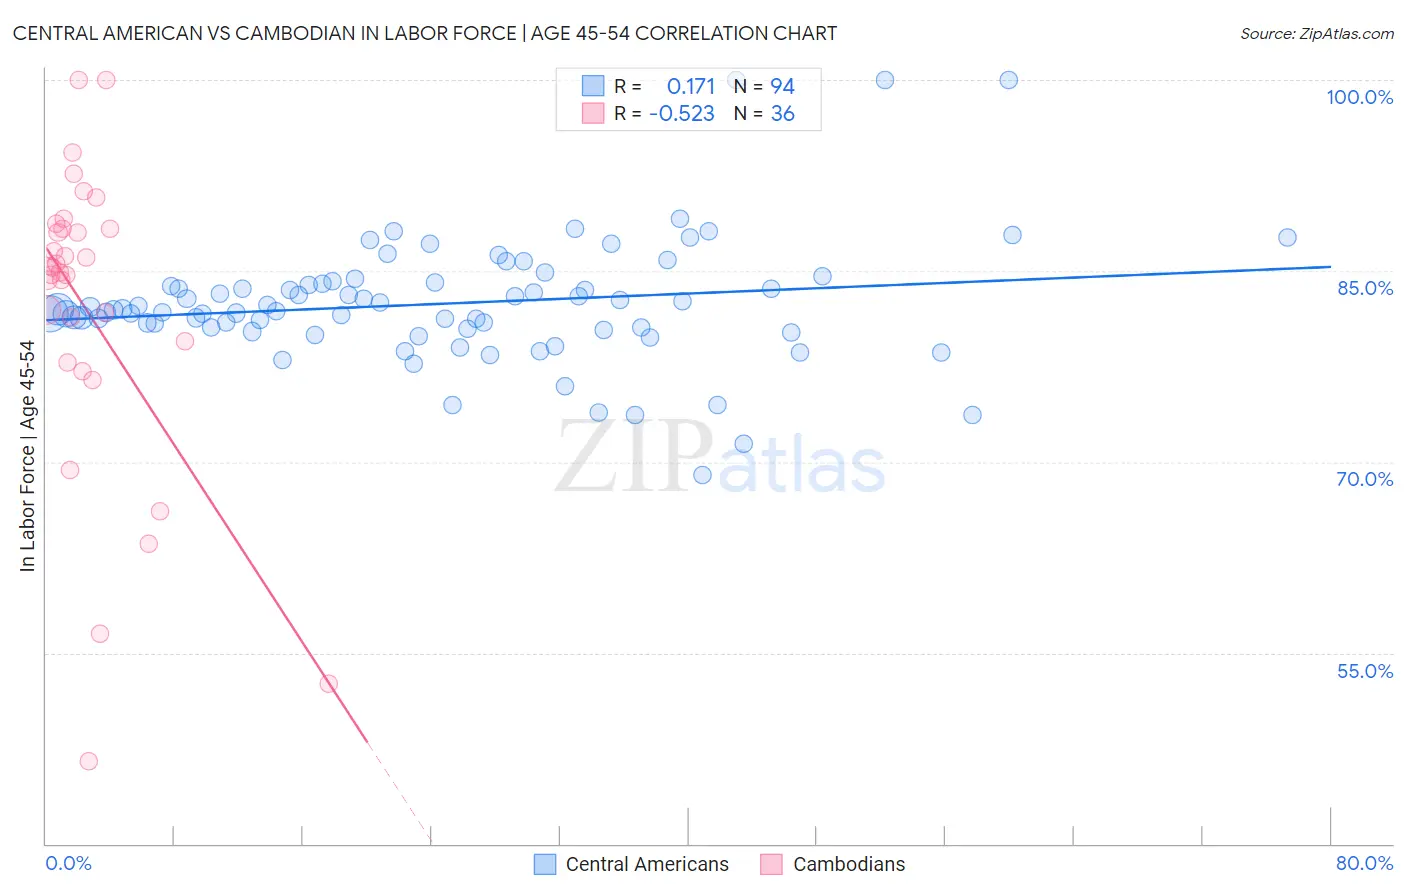
Central American vs Cambodian In Labor Force | Age 45-54 Correlation Chart
The statistical analysis conducted on geographies consisting of 504,028,701 people shows a poor positive correlation between the proportion of Central Americans and labor force participation rate among population between the ages 45 and 54 in the United States with a correlation coefficient (R) of 0.171 and weighted average of 81.7%. Similarly, the statistical analysis conducted on geographies consisting of 102,477,530 people shows a substantial negative correlation between the proportion of Cambodians and labor force participation rate among population between the ages 45 and 54 in the United States with a correlation coefficient (R) of -0.523 and weighted average of 84.1%, a difference of 2.9%.
In Labor Force | Age 45-54 Correlation Summary
| Measurement | Central American | Cambodian |
| Minimum | 69.0% | 46.5% |
| Maximum | 100.0% | 100.0% |
| Range | 31.0% | 53.5% |
| Mean | 82.4% | 81.9% |
| Median | 82.0% | 85.1% |
| Interquartile 25% (IQ1) | 80.5% | 78.7% |
| Interquartile 75% (IQ3) | 84.0% | 88.3% |
| Interquartile Range (IQR) | 3.5% | 9.6% |
| Standard Deviation (Sample) | 4.9% | 12.0% |
| Standard Deviation (Population) | 4.9% | 11.8% |
Similar Demographics by In Labor Force | Age 45-54
Demographics Similar to Central Americans by In Labor Force | Age 45-54
In terms of in labor force | age 45-54, the demographic groups most similar to Central Americans are Alaska Native (81.8%, a difference of 0.020%), Alaskan Athabascan (81.8%, a difference of 0.020%), Puget Sound Salish (81.7%, a difference of 0.020%), Celtic (81.8%, a difference of 0.040%), and Hmong (81.7%, a difference of 0.040%).
| Demographics | Rating | Rank | In Labor Force | Age 45-54 |
| Immigrants | El Salvador | 1.0 /100 | #240 | Tragic 81.9% |
| Immigrants | Cambodia | 0.8 /100 | #241 | Tragic 81.9% |
| Whites/Caucasians | 0.7 /100 | #242 | Tragic 81.9% |
| Samoans | 0.6 /100 | #243 | Tragic 81.8% |
| Celtics | 0.4 /100 | #244 | Tragic 81.8% |
| Alaska Natives | 0.4 /100 | #245 | Tragic 81.8% |
| Alaskan Athabascans | 0.4 /100 | #246 | Tragic 81.8% |
| Central Americans | 0.4 /100 | #247 | Tragic 81.7% |
| Puget Sound Salish | 0.3 /100 | #248 | Tragic 81.7% |
| Hmong | 0.3 /100 | #249 | Tragic 81.7% |
| Immigrants | Armenia | 0.2 /100 | #250 | Tragic 81.7% |
| Guamanians/Chamorros | 0.2 /100 | #251 | Tragic 81.6% |
| Pennsylvania Germans | 0.2 /100 | #252 | Tragic 81.6% |
| Japanese | 0.2 /100 | #253 | Tragic 81.6% |
| Immigrants | Laos | 0.2 /100 | #254 | Tragic 81.6% |
Demographics Similar to Cambodians by In Labor Force | Age 45-54
In terms of in labor force | age 45-54, the demographic groups most similar to Cambodians are Chinese (84.1%, a difference of 0.030%), Cypriot (84.1%, a difference of 0.060%), Immigrants from Nepal (84.0%, a difference of 0.080%), Zimbabwean (84.0%, a difference of 0.10%), and Immigrants from South Central Asia (84.0%, a difference of 0.10%).
| Demographics | Rating | Rank | In Labor Force | Age 45-54 |
| Immigrants | Cameroon | 100.0 /100 | #7 | Exceptional 84.6% |
| Sierra Leoneans | 100.0 /100 | #8 | Exceptional 84.5% |
| Immigrants | Sierra Leone | 100.0 /100 | #9 | Exceptional 84.4% |
| Norwegians | 100.0 /100 | #10 | Exceptional 84.4% |
| Thais | 100.0 /100 | #11 | Exceptional 84.3% |
| Bulgarians | 100.0 /100 | #12 | Exceptional 84.2% |
| Chinese | 99.9 /100 | #13 | Exceptional 84.1% |
| Cambodians | 99.9 /100 | #14 | Exceptional 84.1% |
| Cypriots | 99.9 /100 | #15 | Exceptional 84.1% |
| Immigrants | Nepal | 99.9 /100 | #16 | Exceptional 84.0% |
| Zimbabweans | 99.9 /100 | #17 | Exceptional 84.0% |
| Immigrants | South Central Asia | 99.9 /100 | #18 | Exceptional 84.0% |
| Czechs | 99.8 /100 | #19 | Exceptional 83.9% |
| Immigrants | Eastern Africa | 99.8 /100 | #20 | Exceptional 83.9% |
| Immigrants | Sri Lanka | 99.8 /100 | #21 | Exceptional 83.9% |