Immigrants from Austria vs Cambodian In Labor Force | Age 45-54
COMPARE
Immigrants from Austria
Cambodian
In Labor Force | Age 45-54
In Labor Force | Age 45-54 Comparison
Immigrants from Austria
Cambodians
82.9%
IN LABOR FORCE | AGE 45-54
64.6/ 100
METRIC RATING
159th/ 347
METRIC RANK
84.1%
IN LABOR FORCE | AGE 45-54
99.9/ 100
METRIC RATING
14th/ 347
METRIC RANK
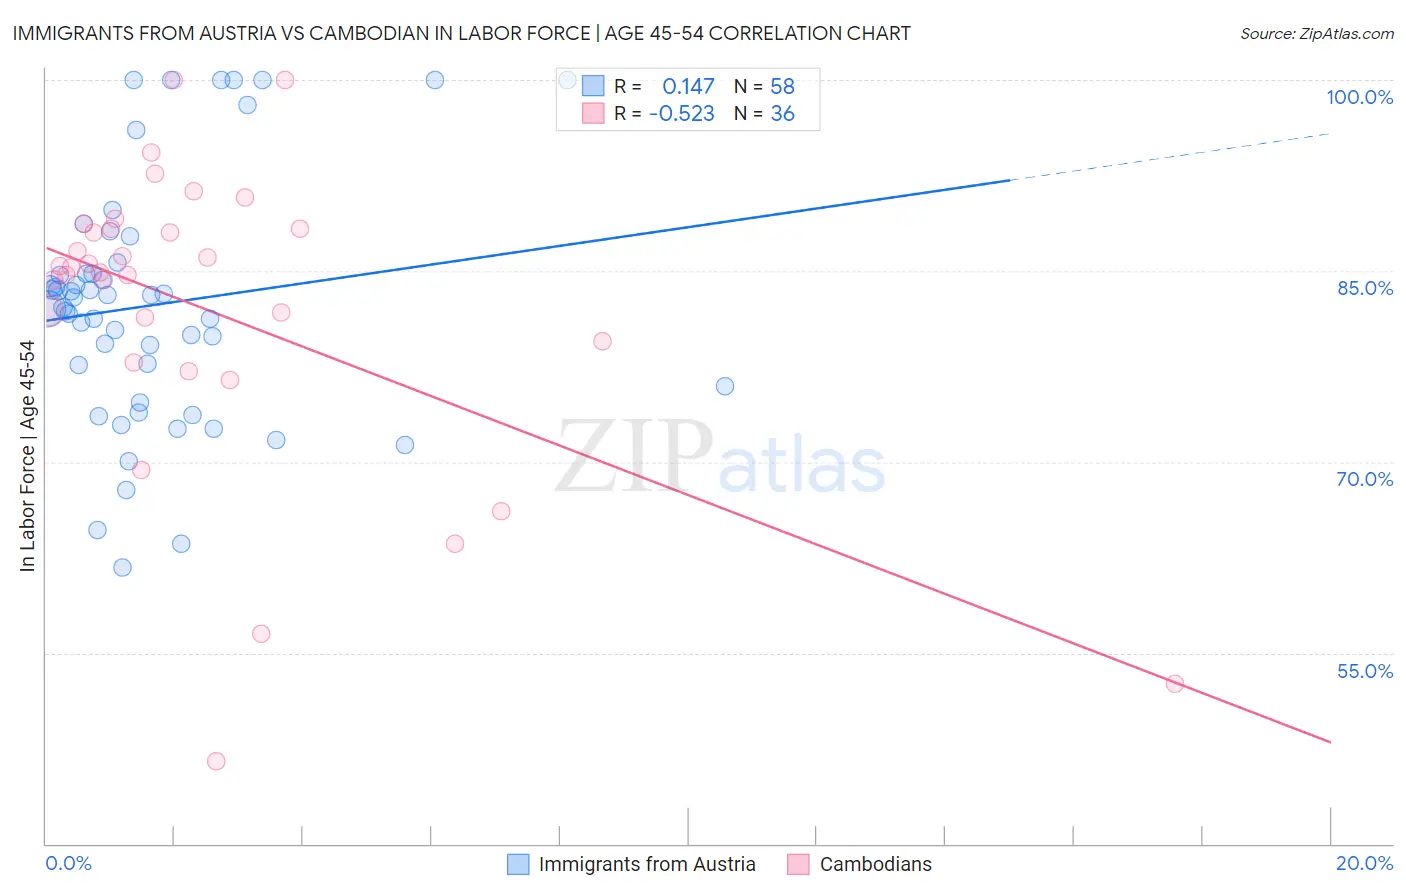
Immigrants from Austria vs Cambodian In Labor Force | Age 45-54 Correlation Chart
The statistical analysis conducted on geographies consisting of 167,955,252 people shows a poor positive correlation between the proportion of Immigrants from Austria and labor force participation rate among population between the ages 45 and 54 in the United States with a correlation coefficient (R) of 0.147 and weighted average of 82.9%. Similarly, the statistical analysis conducted on geographies consisting of 102,477,530 people shows a substantial negative correlation between the proportion of Cambodians and labor force participation rate among population between the ages 45 and 54 in the United States with a correlation coefficient (R) of -0.523 and weighted average of 84.1%, a difference of 1.5%.
In Labor Force | Age 45-54 Correlation Summary
| Measurement | Immigrants from Austria | Cambodian |
| Minimum | 61.7% | 46.5% |
| Maximum | 100.0% | 100.0% |
| Range | 38.3% | 53.5% |
| Mean | 82.3% | 81.9% |
| Median | 82.5% | 85.1% |
| Interquartile 25% (IQ1) | 75.9% | 78.7% |
| Interquartile 75% (IQ3) | 84.8% | 88.3% |
| Interquartile Range (IQR) | 8.9% | 9.6% |
| Standard Deviation (Sample) | 9.5% | 12.0% |
| Standard Deviation (Population) | 9.5% | 11.8% |
Similar Demographics by In Labor Force | Age 45-54
Demographics Similar to Immigrants from Austria by In Labor Force | Age 45-54
In terms of in labor force | age 45-54, the demographic groups most similar to Immigrants from Austria are Laotian (82.9%, a difference of 0.020%), South American Indian (82.9%, a difference of 0.020%), Immigrants from Southern Europe (82.9%, a difference of 0.030%), Haitian (82.8%, a difference of 0.030%), and Dutch (82.8%, a difference of 0.030%).
| Demographics | Rating | Rank | In Labor Force | Age 45-54 |
| Slavs | 71.5 /100 | #152 | Good 82.9% |
| Immigrants | Indonesia | 70.6 /100 | #153 | Good 82.9% |
| Immigrants | Ghana | 70.3 /100 | #154 | Good 82.9% |
| Immigrants | Philippines | 69.0 /100 | #155 | Good 82.9% |
| Immigrants | Saudi Arabia | 68.8 /100 | #156 | Good 82.9% |
| Immigrants | Australia | 68.2 /100 | #157 | Good 82.9% |
| Immigrants | Southern Europe | 67.8 /100 | #158 | Good 82.9% |
| Immigrants | Austria | 64.6 /100 | #159 | Good 82.9% |
| Laotians | 62.8 /100 | #160 | Good 82.9% |
| South American Indians | 62.2 /100 | #161 | Good 82.9% |
| Haitians | 61.8 /100 | #162 | Good 82.8% |
| Dutch | 61.7 /100 | #163 | Good 82.8% |
| German Russians | 61.3 /100 | #164 | Good 82.8% |
| Immigrants | Sudan | 59.9 /100 | #165 | Average 82.8% |
| Immigrants | South Eastern Asia | 57.4 /100 | #166 | Average 82.8% |
Demographics Similar to Cambodians by In Labor Force | Age 45-54
In terms of in labor force | age 45-54, the demographic groups most similar to Cambodians are Chinese (84.1%, a difference of 0.030%), Cypriot (84.1%, a difference of 0.060%), Immigrants from Nepal (84.0%, a difference of 0.080%), Zimbabwean (84.0%, a difference of 0.10%), and Immigrants from South Central Asia (84.0%, a difference of 0.10%).
| Demographics | Rating | Rank | In Labor Force | Age 45-54 |
| Immigrants | Cameroon | 100.0 /100 | #7 | Exceptional 84.6% |
| Sierra Leoneans | 100.0 /100 | #8 | Exceptional 84.5% |
| Immigrants | Sierra Leone | 100.0 /100 | #9 | Exceptional 84.4% |
| Norwegians | 100.0 /100 | #10 | Exceptional 84.4% |
| Thais | 100.0 /100 | #11 | Exceptional 84.3% |
| Bulgarians | 100.0 /100 | #12 | Exceptional 84.2% |
| Chinese | 99.9 /100 | #13 | Exceptional 84.1% |
| Cambodians | 99.9 /100 | #14 | Exceptional 84.1% |
| Cypriots | 99.9 /100 | #15 | Exceptional 84.1% |
| Immigrants | Nepal | 99.9 /100 | #16 | Exceptional 84.0% |
| Zimbabweans | 99.9 /100 | #17 | Exceptional 84.0% |
| Immigrants | South Central Asia | 99.9 /100 | #18 | Exceptional 84.0% |
| Czechs | 99.8 /100 | #19 | Exceptional 83.9% |
| Immigrants | Eastern Africa | 99.8 /100 | #20 | Exceptional 83.9% |
| Immigrants | Sri Lanka | 99.8 /100 | #21 | Exceptional 83.9% |