Canadian vs Syrian In Labor Force | Age 45-54
COMPARE
Canadian
Syrian
In Labor Force | Age 45-54
In Labor Force | Age 45-54 Comparison
Canadians
Syrians
82.4%
IN LABOR FORCE | AGE 45-54
15.1/ 100
METRIC RATING
201st/ 347
METRIC RANK
82.6%
IN LABOR FORCE | AGE 45-54
26.0/ 100
METRIC RATING
189th/ 347
METRIC RANK
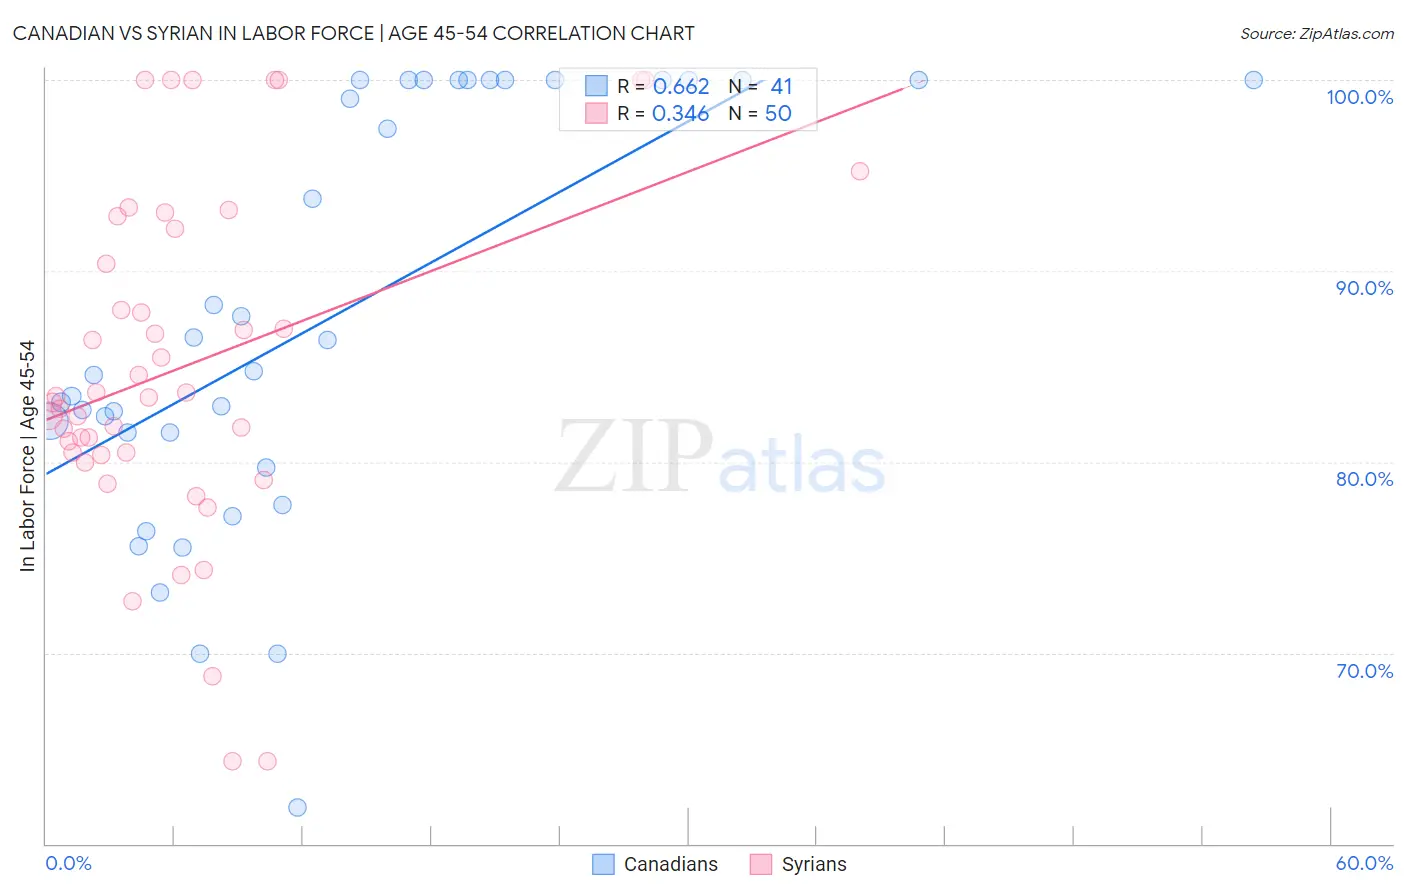
Canadian vs Syrian In Labor Force | Age 45-54 Correlation Chart
The statistical analysis conducted on geographies consisting of 437,259,773 people shows a significant positive correlation between the proportion of Canadians and labor force participation rate among population between the ages 45 and 54 in the United States with a correlation coefficient (R) of 0.662 and weighted average of 82.4%. Similarly, the statistical analysis conducted on geographies consisting of 266,195,129 people shows a mild positive correlation between the proportion of Syrians and labor force participation rate among population between the ages 45 and 54 in the United States with a correlation coefficient (R) of 0.346 and weighted average of 82.6%, a difference of 0.15%.
In Labor Force | Age 45-54 Correlation Summary
| Measurement | Canadian | Syrian |
| Minimum | 61.9% | 64.3% |
| Maximum | 100.0% | 100.0% |
| Range | 38.1% | 35.7% |
| Mean | 87.5% | 85.0% |
| Median | 84.7% | 83.4% |
| Interquartile 25% (IQ1) | 80.6% | 80.5% |
| Interquartile 75% (IQ3) | 100.0% | 92.2% |
| Interquartile Range (IQR) | 19.4% | 11.7% |
| Standard Deviation (Sample) | 10.8% | 8.9% |
| Standard Deviation (Population) | 10.7% | 8.9% |
Demographics Similar to Canadians and Syrians by In Labor Force | Age 45-54
In terms of in labor force | age 45-54, the demographic groups most similar to Canadians are Immigrants from Western Asia (82.4%, a difference of 0.0%), Moroccan (82.5%, a difference of 0.010%), French Canadian (82.5%, a difference of 0.010%), Lebanese (82.5%, a difference of 0.050%), and Immigrants from Denmark (82.5%, a difference of 0.050%). Similarly, the demographic groups most similar to Syrians are British (82.6%, a difference of 0.0%), South African (82.6%, a difference of 0.020%), Irish (82.6%, a difference of 0.030%), Immigrants from Costa Rica (82.6%, a difference of 0.030%), and Armenian (82.5%, a difference of 0.030%).
| Demographics | Rating | Rank | In Labor Force | Age 45-54 |
| Immigrants | England | 32.2 /100 | #185 | Fair 82.6% |
| Irish | 29.2 /100 | #186 | Fair 82.6% |
| Immigrants | Costa Rica | 28.3 /100 | #187 | Fair 82.6% |
| South Africans | 28.0 /100 | #188 | Fair 82.6% |
| Syrians | 26.0 /100 | #189 | Fair 82.6% |
| British | 25.7 /100 | #190 | Fair 82.6% |
| Armenians | 23.2 /100 | #191 | Fair 82.5% |
| Immigrants | Iraq | 20.9 /100 | #192 | Fair 82.5% |
| Australians | 20.8 /100 | #193 | Fair 82.5% |
| Immigrants | Norway | 20.7 /100 | #194 | Fair 82.5% |
| Immigrants | Canada | 20.0 /100 | #195 | Fair 82.5% |
| Immigrants | North America | 18.8 /100 | #196 | Poor 82.5% |
| Lebanese | 18.2 /100 | #197 | Poor 82.5% |
| Immigrants | Denmark | 17.9 /100 | #198 | Poor 82.5% |
| Moroccans | 15.7 /100 | #199 | Poor 82.5% |
| French Canadians | 15.4 /100 | #200 | Poor 82.5% |
| Canadians | 15.1 /100 | #201 | Poor 82.4% |
| Immigrants | Western Asia | 14.9 /100 | #202 | Poor 82.4% |
| Arabs | 11.6 /100 | #203 | Poor 82.4% |
| Immigrants | Western Europe | 10.9 /100 | #204 | Poor 82.4% |
| Senegalese | 9.5 /100 | #205 | Tragic 82.4% |