Immigrants from Japan vs Syrian In Labor Force | Age 45-54
COMPARE
Immigrants from Japan
Syrian
In Labor Force | Age 45-54
In Labor Force | Age 45-54 Comparison
Immigrants from Japan
Syrians
83.3%
IN LABOR FORCE | AGE 45-54
95.5/ 100
METRIC RATING
90th/ 347
METRIC RANK
82.6%
IN LABOR FORCE | AGE 45-54
26.0/ 100
METRIC RATING
189th/ 347
METRIC RANK
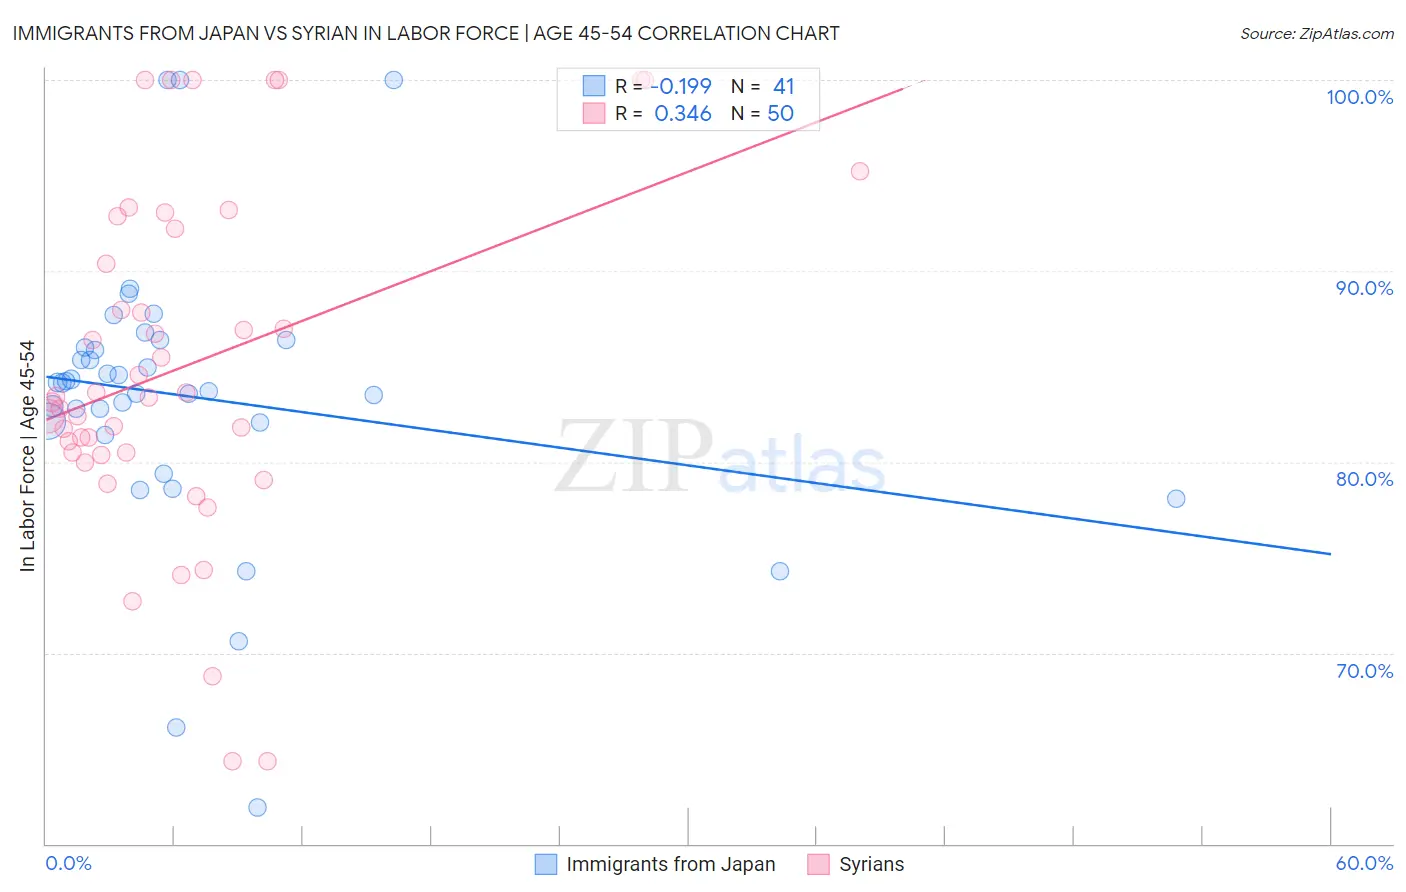
Immigrants from Japan vs Syrian In Labor Force | Age 45-54 Correlation Chart
The statistical analysis conducted on geographies consisting of 339,969,041 people shows a poor negative correlation between the proportion of Immigrants from Japan and labor force participation rate among population between the ages 45 and 54 in the United States with a correlation coefficient (R) of -0.199 and weighted average of 83.3%. Similarly, the statistical analysis conducted on geographies consisting of 266,195,129 people shows a mild positive correlation between the proportion of Syrians and labor force participation rate among population between the ages 45 and 54 in the United States with a correlation coefficient (R) of 0.346 and weighted average of 82.6%, a difference of 0.90%.
In Labor Force | Age 45-54 Correlation Summary
| Measurement | Immigrants from Japan | Syrian |
| Minimum | 61.9% | 64.3% |
| Maximum | 100.0% | 100.0% |
| Range | 38.1% | 35.7% |
| Mean | 83.4% | 85.0% |
| Median | 84.1% | 83.4% |
| Interquartile 25% (IQ1) | 81.7% | 80.5% |
| Interquartile 75% (IQ3) | 86.2% | 92.2% |
| Interquartile Range (IQR) | 4.4% | 11.7% |
| Standard Deviation (Sample) | 7.4% | 8.9% |
| Standard Deviation (Population) | 7.3% | 8.9% |
Similar Demographics by In Labor Force | Age 45-54
Demographics Similar to Immigrants from Japan by In Labor Force | Age 45-54
In terms of in labor force | age 45-54, the demographic groups most similar to Immigrants from Japan are Immigrants from Eastern Europe (83.3%, a difference of 0.0%), Immigrants from Asia (83.3%, a difference of 0.0%), Indian (Asian) (83.3%, a difference of 0.0%), South American (83.3%, a difference of 0.0%), and Immigrants from Northern Africa (83.3%, a difference of 0.010%).
| Demographics | Rating | Rank | In Labor Force | Age 45-54 |
| Immigrants | Zimbabwe | 96.3 /100 | #83 | Exceptional 83.4% |
| Immigrants | Bosnia and Herzegovina | 96.0 /100 | #84 | Exceptional 83.3% |
| Greeks | 95.9 /100 | #85 | Exceptional 83.3% |
| Immigrants | Northern Africa | 95.7 /100 | #86 | Exceptional 83.3% |
| Immigrants | Eastern Europe | 95.6 /100 | #87 | Exceptional 83.3% |
| Immigrants | Asia | 95.6 /100 | #88 | Exceptional 83.3% |
| Indians (Asian) | 95.5 /100 | #89 | Exceptional 83.3% |
| Immigrants | Japan | 95.5 /100 | #90 | Exceptional 83.3% |
| South Americans | 95.5 /100 | #91 | Exceptional 83.3% |
| Danes | 95.3 /100 | #92 | Exceptional 83.3% |
| Italians | 95.1 /100 | #93 | Exceptional 83.3% |
| Argentineans | 94.9 /100 | #94 | Exceptional 83.3% |
| Immigrants | Argentina | 94.9 /100 | #95 | Exceptional 83.3% |
| Immigrants | Kuwait | 94.8 /100 | #96 | Exceptional 83.3% |
| Palestinians | 94.8 /100 | #97 | Exceptional 83.3% |
Demographics Similar to Syrians by In Labor Force | Age 45-54
In terms of in labor force | age 45-54, the demographic groups most similar to Syrians are British (82.6%, a difference of 0.0%), South African (82.6%, a difference of 0.020%), Irish (82.6%, a difference of 0.030%), Immigrants from Costa Rica (82.6%, a difference of 0.030%), and Armenian (82.5%, a difference of 0.030%).
| Demographics | Rating | Rank | In Labor Force | Age 45-54 |
| Immigrants | Hungary | 37.1 /100 | #182 | Fair 82.7% |
| New Zealanders | 32.7 /100 | #183 | Fair 82.6% |
| Europeans | 32.6 /100 | #184 | Fair 82.6% |
| Immigrants | England | 32.2 /100 | #185 | Fair 82.6% |
| Irish | 29.2 /100 | #186 | Fair 82.6% |
| Immigrants | Costa Rica | 28.3 /100 | #187 | Fair 82.6% |
| South Africans | 28.0 /100 | #188 | Fair 82.6% |
| Syrians | 26.0 /100 | #189 | Fair 82.6% |
| British | 25.7 /100 | #190 | Fair 82.6% |
| Armenians | 23.2 /100 | #191 | Fair 82.5% |
| Immigrants | Iraq | 20.9 /100 | #192 | Fair 82.5% |
| Australians | 20.8 /100 | #193 | Fair 82.5% |
| Immigrants | Norway | 20.7 /100 | #194 | Fair 82.5% |
| Immigrants | Canada | 20.0 /100 | #195 | Fair 82.5% |
| Immigrants | North America | 18.8 /100 | #196 | Poor 82.5% |