Zip Codes with the Highest Percentage of Households Without a Vehicle in Mandeville, LA
RELATED REPORTS & OPTIONS
Households without a Cars
Mandeville
Compare Zip Codes
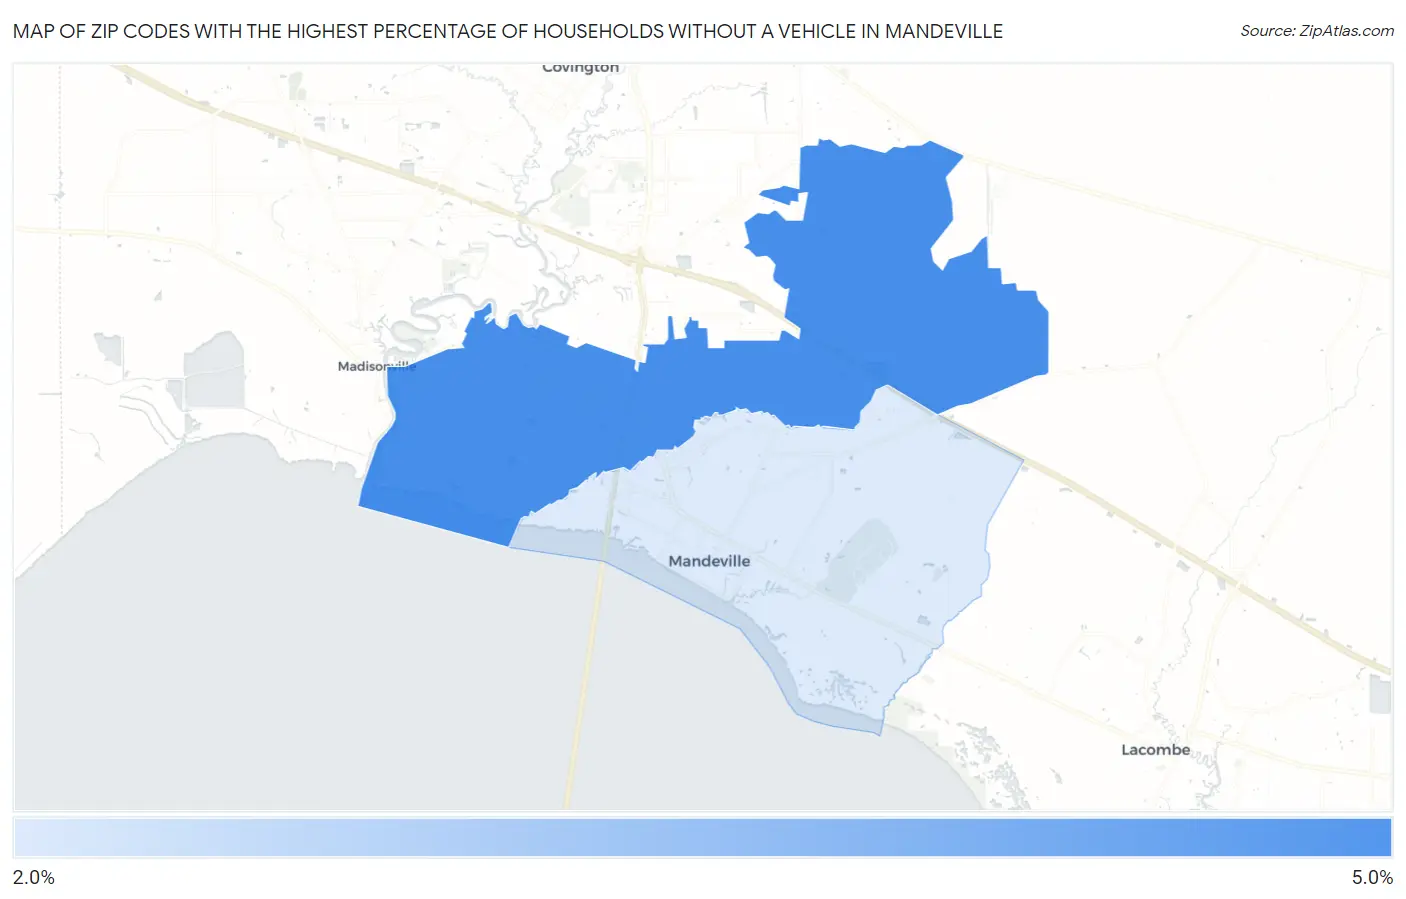
Map of Zip Codes with the Highest Percentage of Households Without a Vehicle in Mandeville
2.3%
4.3%
Zip Codes with the Highest Percentage of Households Without a Vehicle in Mandeville, LA
| Zip Code | Housholds Without a Car | vs State | vs National | |
| 1. | 70471 | 4.3% | 8.3%(-4.00)#318 | 8.3%(-4.00)#14,816 |
| 2. | 70448 | 2.3% | 8.3%(-6.00)#391 | 8.3%(-6.00)#21,386 |
1
Common Questions
What are the Top Zip Codes with the Highest Percentage of Households Without a Vehicle in Mandeville, LA?
Top Zip Codes with the Highest Percentage of Households Without a Vehicle in Mandeville, LA are:
What zip code has the Highest Percentage of Households Without a Vehicle in Mandeville, LA?
70471 has the Highest Percentage of Households Without a Vehicle in Mandeville, LA with 4.3%.
What is the Percentage of Households Without a Vehicle in Mandeville, LA?
Percentage of Households Without a Vehicle in Mandeville is 7.6%.
What is the Percentage of Households Without a Vehicle in Louisiana?
Percentage of Households Without a Vehicle in Louisiana is 8.3%.
What is the Percentage of Households Without a Vehicle in the United States?
Percentage of Households Without a Vehicle in the United States is 8.3%.