Yuman vs Immigrants from Barbados Householder Income Over 65 years
COMPARE
Yuman
Immigrants from Barbados
Householder Income Over 65 years
Householder Income Over 65 years Comparison
Yuman
Immigrants from Barbados
$53,110
HOUSEHOLDER INCOME OVER 65 YEARS
0.0/ 100
METRIC RATING
301st/ 347
METRIC RANK
$53,766
HOUSEHOLDER INCOME OVER 65 YEARS
0.1/ 100
METRIC RATING
287th/ 347
METRIC RANK
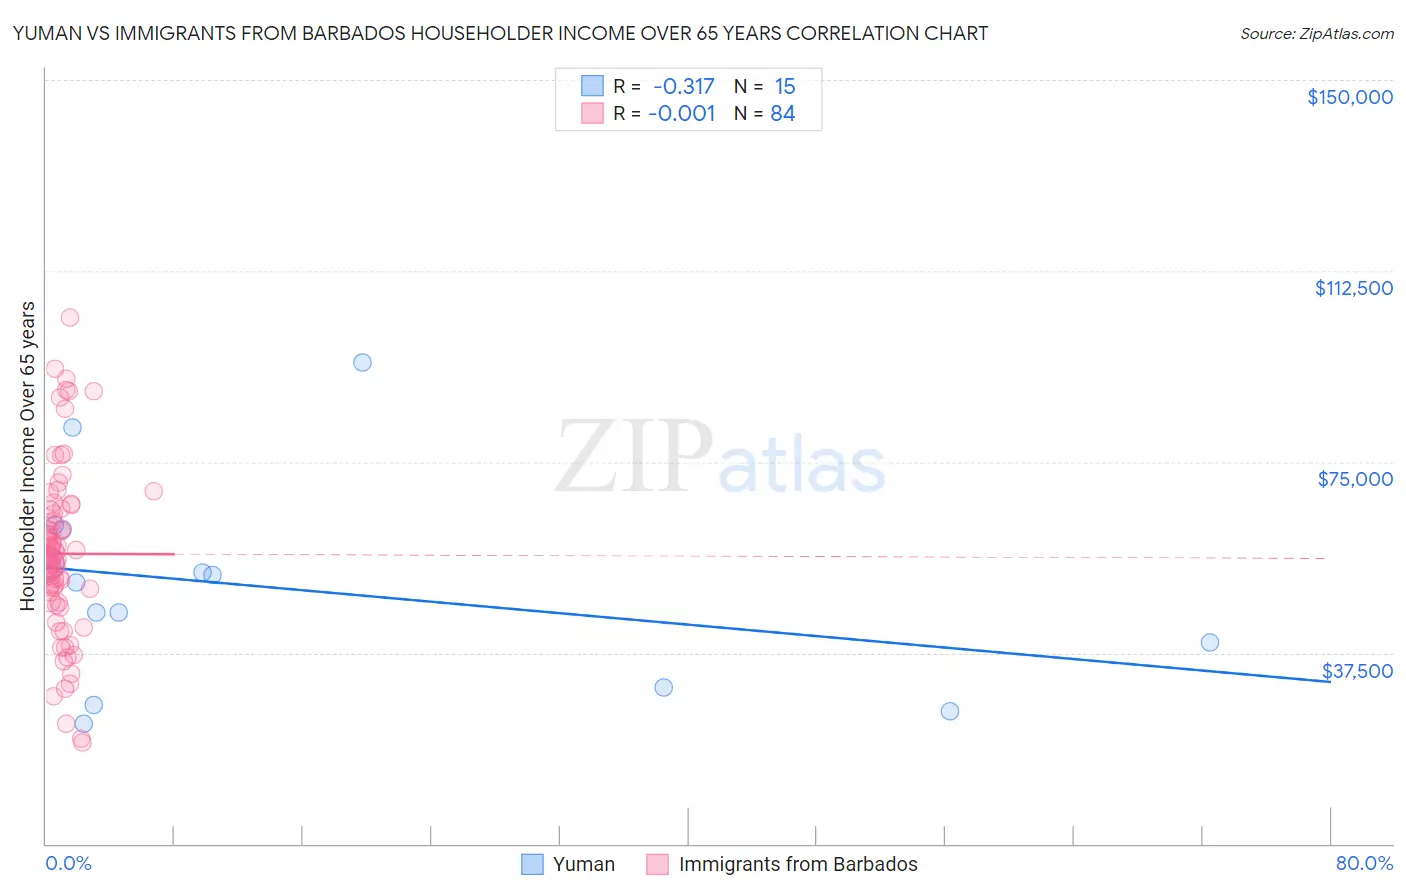
Yuman vs Immigrants from Barbados Householder Income Over 65 years Correlation Chart
The statistical analysis conducted on geographies consisting of 40,575,532 people shows a mild negative correlation between the proportion of Yuman and household income with householder over the age of 65 in the United States with a correlation coefficient (R) of -0.317 and weighted average of $53,110. Similarly, the statistical analysis conducted on geographies consisting of 112,730,897 people shows no correlation between the proportion of Immigrants from Barbados and household income with householder over the age of 65 in the United States with a correlation coefficient (R) of -0.001 and weighted average of $53,766, a difference of 1.2%.
Householder Income Over 65 years Correlation Summary
| Measurement | Yuman | Immigrants from Barbados |
| Minimum | $23,487 | $19,809 |
| Maximum | $94,583 | $103,317 |
| Range | $71,096 | $83,508 |
| Mean | $50,051 | $56,943 |
| Median | $51,214 | $56,493 |
| Interquartile 25% (IQ1) | $30,588 | $48,534 |
| Interquartile 75% (IQ3) | $61,733 | $65,164 |
| Interquartile Range (IQR) | $31,145 | $16,630 |
| Standard Deviation (Sample) | $20,083 | $16,514 |
| Standard Deviation (Population) | $19,402 | $16,415 |
Demographics Similar to Yuman and Immigrants from Barbados by Householder Income Over 65 years
In terms of householder income over 65 years, the demographic groups most similar to Yuman are Spanish American Indian ($53,077, a difference of 0.060%), Choctaw ($53,060, a difference of 0.090%), Immigrants from Bahamas ($53,174, a difference of 0.12%), Ottawa ($53,217, a difference of 0.20%), and Central American Indian ($53,232, a difference of 0.23%). Similarly, the demographic groups most similar to Immigrants from Barbados are Paiute ($53,762, a difference of 0.010%), Iroquois ($53,737, a difference of 0.050%), Chickasaw ($53,732, a difference of 0.060%), African ($53,711, a difference of 0.10%), and Chippewa ($53,847, a difference of 0.15%).
| Demographics | Rating | Rank | Householder Income Over 65 years |
| Immigrants | Guatemala | 0.1 /100 | #284 | Tragic $53,950 |
| Mexicans | 0.1 /100 | #285 | Tragic $53,897 |
| Chippewa | 0.1 /100 | #286 | Tragic $53,847 |
| Immigrants | Barbados | 0.1 /100 | #287 | Tragic $53,766 |
| Paiute | 0.1 /100 | #288 | Tragic $53,762 |
| Iroquois | 0.1 /100 | #289 | Tragic $53,737 |
| Chickasaw | 0.1 /100 | #290 | Tragic $53,732 |
| Africans | 0.0 /100 | #291 | Tragic $53,711 |
| Shoshone | 0.0 /100 | #292 | Tragic $53,681 |
| Immigrants | Belize | 0.0 /100 | #293 | Tragic $53,665 |
| Senegalese | 0.0 /100 | #294 | Tragic $53,591 |
| Immigrants | Central America | 0.0 /100 | #295 | Tragic $53,420 |
| Immigrants | Somalia | 0.0 /100 | #296 | Tragic $53,333 |
| Immigrants | Latin America | 0.0 /100 | #297 | Tragic $53,265 |
| Central American Indians | 0.0 /100 | #298 | Tragic $53,232 |
| Ottawa | 0.0 /100 | #299 | Tragic $53,217 |
| Immigrants | Bahamas | 0.0 /100 | #300 | Tragic $53,174 |
| Yuman | 0.0 /100 | #301 | Tragic $53,110 |
| Spanish American Indians | 0.0 /100 | #302 | Tragic $53,077 |
| Choctaw | 0.0 /100 | #303 | Tragic $53,060 |
| Ute | 0.0 /100 | #304 | Tragic $52,949 |