Cypriot vs Immigrants from Barbados Householder Income Over 65 years
COMPARE
Cypriot
Immigrants from Barbados
Householder Income Over 65 years
Householder Income Over 65 years Comparison
Cypriots
Immigrants from Barbados
$71,714
HOUSEHOLDER INCOME OVER 65 YEARS
100.0/ 100
METRIC RATING
12th/ 347
METRIC RANK
$53,766
HOUSEHOLDER INCOME OVER 65 YEARS
0.1/ 100
METRIC RATING
287th/ 347
METRIC RANK
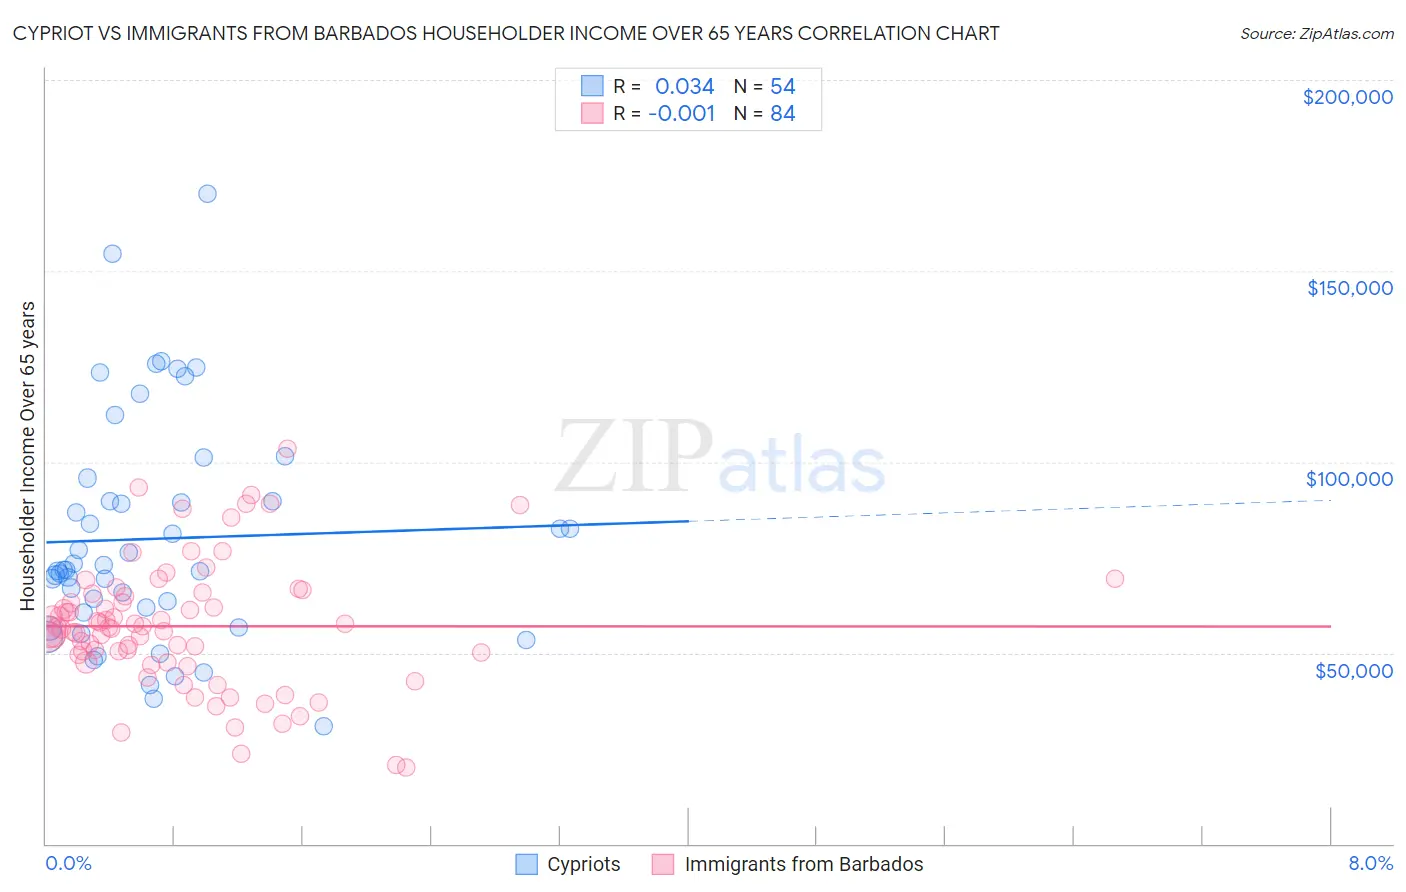
Cypriot vs Immigrants from Barbados Householder Income Over 65 years Correlation Chart
The statistical analysis conducted on geographies consisting of 61,820,564 people shows no correlation between the proportion of Cypriots and household income with householder over the age of 65 in the United States with a correlation coefficient (R) of 0.034 and weighted average of $71,714. Similarly, the statistical analysis conducted on geographies consisting of 112,730,897 people shows no correlation between the proportion of Immigrants from Barbados and household income with householder over the age of 65 in the United States with a correlation coefficient (R) of -0.001 and weighted average of $53,766, a difference of 33.4%.
Householder Income Over 65 years Correlation Summary
| Measurement | Cypriot | Immigrants from Barbados |
| Minimum | $30,872 | $19,809 |
| Maximum | $170,077 | $103,317 |
| Range | $139,205 | $83,508 |
| Mean | $79,873 | $56,943 |
| Median | $71,621 | $56,493 |
| Interquartile 25% (IQ1) | $60,572 | $48,534 |
| Interquartile 75% (IQ3) | $89,592 | $65,164 |
| Interquartile Range (IQR) | $29,021 | $16,630 |
| Standard Deviation (Sample) | $29,548 | $16,514 |
| Standard Deviation (Population) | $29,273 | $16,415 |
Similar Demographics by Householder Income Over 65 years
Demographics Similar to Cypriots by Householder Income Over 65 years
In terms of householder income over 65 years, the demographic groups most similar to Cypriots are Immigrants from Hong Kong ($71,567, a difference of 0.20%), Thai ($72,099, a difference of 0.54%), Bhutanese ($72,288, a difference of 0.80%), Burmese ($71,139, a difference of 0.81%), and Native Hawaiian ($71,021, a difference of 0.98%).
| Demographics | Rating | Rank | Householder Income Over 65 years |
| Immigrants | Iran | 100.0 /100 | #5 | Exceptional $75,081 |
| Bolivians | 100.0 /100 | #6 | Exceptional $74,245 |
| Immigrants | Bolivia | 100.0 /100 | #7 | Exceptional $73,434 |
| Immigrants | Singapore | 100.0 /100 | #8 | Exceptional $72,963 |
| Immigrants | India | 100.0 /100 | #9 | Exceptional $72,804 |
| Bhutanese | 100.0 /100 | #10 | Exceptional $72,288 |
| Thais | 100.0 /100 | #11 | Exceptional $72,099 |
| Cypriots | 100.0 /100 | #12 | Exceptional $71,714 |
| Immigrants | Hong Kong | 100.0 /100 | #13 | Exceptional $71,567 |
| Burmese | 100.0 /100 | #14 | Exceptional $71,139 |
| Native Hawaiians | 100.0 /100 | #15 | Exceptional $71,021 |
| Okinawans | 100.0 /100 | #16 | Exceptional $70,846 |
| Immigrants | Korea | 100.0 /100 | #17 | Exceptional $70,696 |
| Eastern Europeans | 100.0 /100 | #18 | Exceptional $70,470 |
| Indians (Asian) | 100.0 /100 | #19 | Exceptional $70,238 |
Demographics Similar to Immigrants from Barbados by Householder Income Over 65 years
In terms of householder income over 65 years, the demographic groups most similar to Immigrants from Barbados are Paiute ($53,762, a difference of 0.010%), Iroquois ($53,737, a difference of 0.050%), Chickasaw ($53,732, a difference of 0.060%), African ($53,711, a difference of 0.10%), and Chippewa ($53,847, a difference of 0.15%).
| Demographics | Rating | Rank | Householder Income Over 65 years |
| Immigrants | Jamaica | 0.1 /100 | #280 | Tragic $54,027 |
| Somalis | 0.1 /100 | #281 | Tragic $54,004 |
| Immigrants | Armenia | 0.1 /100 | #282 | Tragic $53,974 |
| Immigrants | Liberia | 0.1 /100 | #283 | Tragic $53,967 |
| Immigrants | Guatemala | 0.1 /100 | #284 | Tragic $53,950 |
| Mexicans | 0.1 /100 | #285 | Tragic $53,897 |
| Chippewa | 0.1 /100 | #286 | Tragic $53,847 |
| Immigrants | Barbados | 0.1 /100 | #287 | Tragic $53,766 |
| Paiute | 0.1 /100 | #288 | Tragic $53,762 |
| Iroquois | 0.1 /100 | #289 | Tragic $53,737 |
| Chickasaw | 0.1 /100 | #290 | Tragic $53,732 |
| Africans | 0.0 /100 | #291 | Tragic $53,711 |
| Shoshone | 0.0 /100 | #292 | Tragic $53,681 |
| Immigrants | Belize | 0.0 /100 | #293 | Tragic $53,665 |
| Senegalese | 0.0 /100 | #294 | Tragic $53,591 |