Kenyan vs Fijian Householder Income Over 65 years

COMPARE

Kenyan
Race
Ancestry
AfghanAfricanAlaska NativeAlaskan AthabascanAlbanianAleutAlsatianAmericanApacheArabArapahoArgentineanArmenianAssyrian/Chaldean/SyriacAustralianAustrianBahamianBangladeshiBarbadianBasqueBelgianBelizeanBermudanBhutaneseBlackfeetBolivianBrazilianBritishBritish West IndianBulgarianBurmeseCajunCambodianCanadianCape VerdeanCarpatho RusynCelticCentral AmericanCentral American IndianCherokeeCheyenneChickasawChileanChineseChippewaChoctawColombianColvilleComancheCosta RicanCreeCreekCroatianCrowCubanCypriotCzechCzechoslovakianDanishDelawareDominicanDutchDutch West IndianEastern EuropeanEcuadorianEgyptianEnglishEstonianEthiopianEuropeanFilipinoFinnishFrenchFrench American IndianFrench CanadianGermanGerman RussianGhanaianGreekGuamanian/ChamorroGuatemalanGuyaneseHaitianHmongHonduranHopiHoumaHungarianIcelanderIndian (Asian)IndonesianInupiatIranianIraqiIrishIroquoisIsraeliItalianJamaicanJapaneseJordanianKenyanKiowaKoreanLaotianLatvianLebaneseLiberianLithuanianLumbeeLuxembourgerMacedonianMalaysianMalteseMarshalleseMenomineeMexicanMexican American IndianMongolianMoroccanNative HawaiianNavajoNepaleseNew ZealanderNicaraguanNigerianNorthern EuropeanNorwegianOkinawanOsageOttawaPaiutePakistaniPalestinianPanamanianParaguayanPennsylvania GermanPeruvianPimaPolishPortuguesePotawatomiPuebloPuerto RicanPuget Sound SalishRomanianRussianSalvadoranSamoanScandinavianScotch-IrishScottishSeminoleSenegaleseSerbianShoshoneSierra LeoneanSiouxSlavicSlovakSloveneSomaliSouth AfricanSouth AmericanSouth American IndianSoviet UnionSpaniardSpanishSpanish AmericanSpanish American IndianSri LankanSubsaharan AfricanSudaneseSwedishSwissSyrianTaiwaneseThaiTlingit-HaidaTohono O'OdhamTonganTrinidadian and TobagonianTsimshianTurkishU.S. Virgin IslanderUgandanUkrainianUruguayanUteVenezuelanVietnameseWelshWest IndianYakamaYaquiYugoslavianYumanYup'ikZimbabwean
Immigration
NonimmigrantsImmigrantsAfghanistanAfricaAlbaniaArgentinaArmeniaAsiaAustraliaAustriaBahamasBangladeshBarbadosBelarusBelgiumBelizeBoliviaBosnia and HerzegovinaBrazilBulgariaBurma/MyanmarCabo VerdeCambodiaCameroonCanadaCaribbeanCentral AmericaChileChinaColombiaCongoCosta RicaCroatiaCubaCzechoslovakiaDenmarkDominicaDominican RepublicEastern AfricaEastern AsiaEastern EuropeEcuadorEgyptEl SalvadorEnglandEritreaEthiopiaEuropeFijiFranceGermanyGhanaGreeceGrenadaGuatemalaGuyanaHaitiHondurasHong KongHungaryIndiaIndonesiaIranIraqIrelandIsraelItalyJamaicaJapanJordanKazakhstanKenyaKoreaKuwaitLaosLatin AmericaLatviaLebanonLiberiaLithuaniaMalaysiaMexicoMicronesiaMiddle AfricaMoldovaMoroccoNepalNetherlandsNicaraguaNigeriaNorth AmericaNorth MacedoniaNorthern AfricaNorthern EuropeNorwayOceaniaPakistanPanamaPeruPhilippinesPolandPortugalRomaniaRussiaSaudi ArabiaScotlandSenegalSerbiaSierra LeoneSingaporeSomaliaSouth AfricaSouth AmericaSouth Central AsiaSouth Eastern AsiaSouthern EuropeSpainSri LankaSt. Vincent and the GrenadinesSudanSwedenSwitzerlandSyriaTaiwanThailandTrinidad and TobagoTurkeyUgandaUkraineUruguayUzbekistanVenezuelaVietnamWest IndiesWestern AfricaWestern AsiaWestern EuropeYemenZaireZimbabweAzores
Fijian
Race
Ancestry
AfghanAfricanAlaska NativeAlaskan AthabascanAlbanianAleutAlsatianAmericanApacheArabArapahoArgentineanArmenianAssyrian/Chaldean/SyriacAustralianAustrianBahamianBangladeshiBarbadianBasqueBelgianBelizeanBermudanBhutaneseBlackfeetBolivianBrazilianBritishBritish West IndianBulgarianBurmeseCajunCambodianCanadianCape VerdeanCarpatho RusynCelticCentral AmericanCentral American IndianCherokeeCheyenneChickasawChileanChineseChippewaChoctawColombianColvilleComancheCosta RicanCreeCreekCroatianCrowCubanCypriotCzechCzechoslovakianDanishDelawareDominicanDutchDutch West IndianEastern EuropeanEcuadorianEgyptianEnglishEstonianEthiopianEuropeanFijianFilipinoFinnishFrenchFrench American IndianFrench CanadianGermanGerman RussianGhanaianGreekGuamanian/ChamorroGuatemalanGuyaneseHaitianHmongHonduranHopiHoumaHungarianIcelanderIndian (Asian)IndonesianInupiatIranianIraqiIrishIroquoisIsraeliItalianJamaicanJapaneseJordanianKiowaKoreanLaotianLatvianLebaneseLiberianLithuanianLumbeeLuxembourgerMacedonianMalaysianMalteseMarshalleseMenomineeMexicanMexican American IndianMongolianMoroccanNative HawaiianNavajoNepaleseNew ZealanderNicaraguanNigerianNorthern EuropeanNorwegianOkinawanOsageOttawaPaiutePakistaniPalestinianPanamanianParaguayanPennsylvania GermanPeruvianPimaPolishPortuguesePotawatomiPuebloPuerto RicanPuget Sound SalishRomanianRussianSalvadoranSamoanScandinavianScotch-IrishScottishSeminoleSenegaleseSerbianShoshoneSierra LeoneanSiouxSlavicSlovakSloveneSomaliSouth AfricanSouth AmericanSouth American IndianSoviet UnionSpaniardSpanishSpanish AmericanSpanish American IndianSri LankanSubsaharan AfricanSudaneseSwedishSwissSyrianTaiwaneseThaiTlingit-HaidaTohono O'OdhamTonganTrinidadian and TobagonianTsimshianTurkishU.S. Virgin IslanderUgandanUkrainianUruguayanUteVenezuelanVietnameseWelshWest IndianYakamaYaquiYugoslavianYumanYup'ikZimbabwean
Immigration
NonimmigrantsImmigrantsAfghanistanAfricaAlbaniaArgentinaArmeniaAsiaAustraliaAustriaBahamasBangladeshBarbadosBelarusBelgiumBelizeBoliviaBosnia and HerzegovinaBrazilBulgariaBurma/MyanmarCabo VerdeCambodiaCameroonCanadaCaribbeanCentral AmericaChileChinaColombiaCongoCosta RicaCroatiaCubaCzechoslovakiaDenmarkDominicaDominican RepublicEastern AfricaEastern AsiaEastern EuropeEcuadorEgyptEl SalvadorEnglandEritreaEthiopiaEuropeFijiFranceGermanyGhanaGreeceGrenadaGuatemalaGuyanaHaitiHondurasHong KongHungaryIndiaIndonesiaIranIraqIrelandIsraelItalyJamaicaJapanJordanKazakhstanKenyaKoreaKuwaitLaosLatin AmericaLatviaLebanonLiberiaLithuaniaMalaysiaMexicoMicronesiaMiddle AfricaMoldovaMoroccoNepalNetherlandsNicaraguaNigeriaNorth AmericaNorth MacedoniaNorthern AfricaNorthern EuropeNorwayOceaniaPakistanPanamaPeruPhilippinesPolandPortugalRomaniaRussiaSaudi ArabiaScotlandSenegalSerbiaSierra LeoneSingaporeSomaliaSouth AfricaSouth AmericaSouth Central AsiaSouth Eastern AsiaSouthern EuropeSpainSri LankaSt. Vincent and the GrenadinesSudanSwedenSwitzerlandSyriaTaiwanThailandTrinidad and TobagoTurkeyUgandaUkraineUruguayUzbekistanVenezuelaVietnamWest IndiesWestern AfricaWestern AsiaWestern EuropeYemenZaireZimbabweAzores
Householder Income Over 65 years
Income
Poverty
Unemployment
Labor Participation
Family Structure
Vehicle Availability
Education Level
Disability

Householder Income Over 65 years Comparison

Kenyans

Fijians

Fair
Tragic
$60,514
HOUSEHOLDER INCOME OVER 65 YEARS
38.4/ 100
METRIC RATING
183rd/ 347
METRIC RANK
$56,768
HOUSEHOLDER INCOME OVER 65 YEARS
1.2/ 100
METRIC RATING
238th/ 347
METRIC RANK

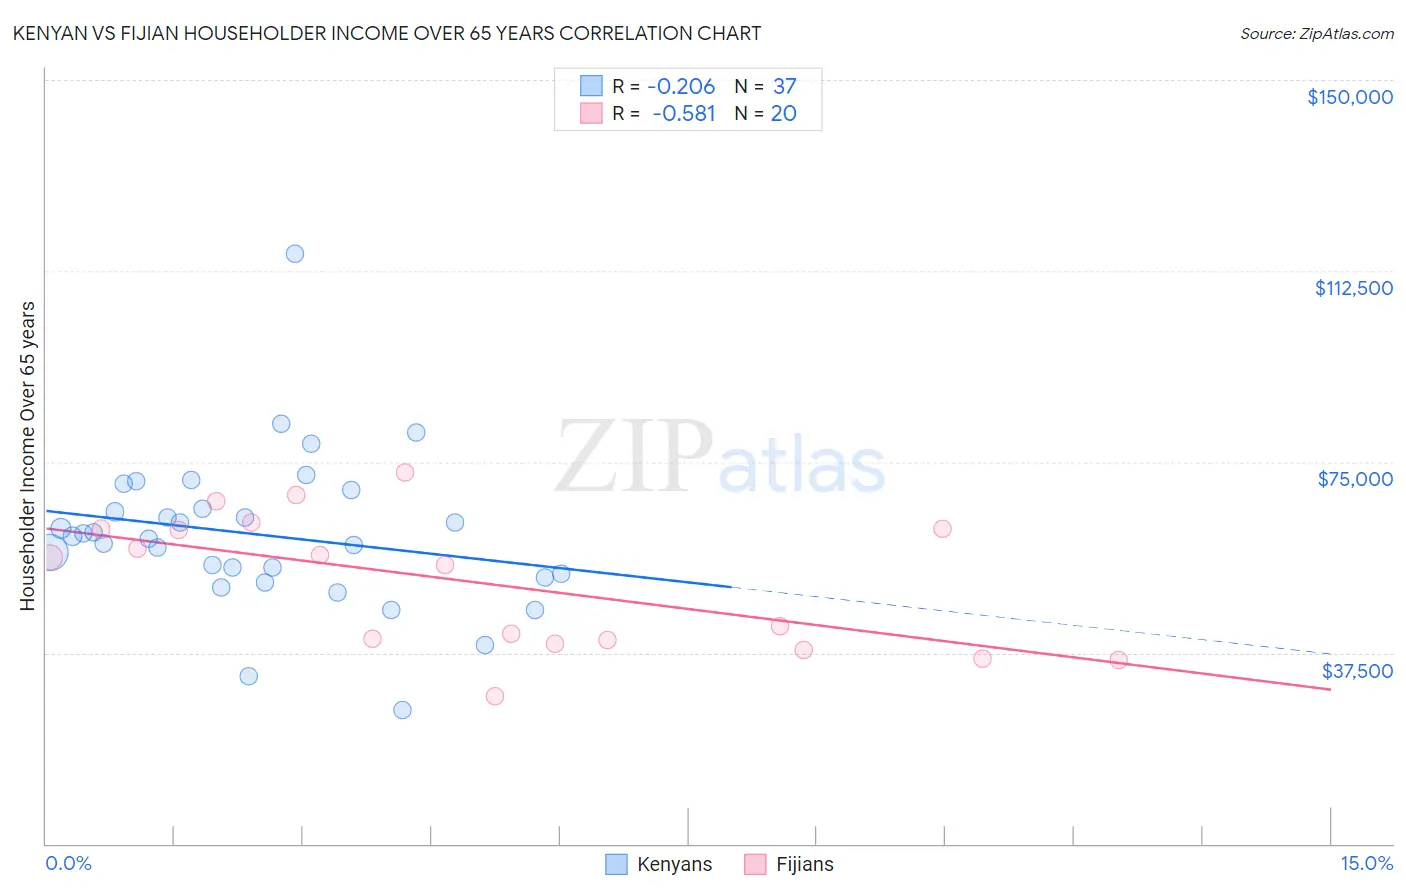
Kenyan vs Fijian Householder Income Over 65 years Correlation Chart

The statistical analysis conducted on geographies consisting of 167,861,948 people shows a weak negative correlation between the proportion of Kenyans and household income with householder over the age of 65 in the United States with a correlation coefficient (R) of -0.206 and weighted average of $60,514. Similarly, the statistical analysis conducted on geographies consisting of 55,863,642 people shows a substantial negative correlation between the proportion of Fijians and household income with householder over the age of 65 in the United States with a correlation coefficient (R) of -0.581 and weighted average of $56,768, a difference of 6.6%.
Kenyan vs Fijian Householder Income Over 65 years

Householder Income Over 65 years Correlation Summary

MeasurementKenyanFijian
Minimum$26,155$29,091
Maximum$115,950$72,983
Range$89,795$43,892
Mean$60,697$51,272
Median$60,482$55,405
Interquartile 25% (IQ1)$52,723$39,651
Interquartile 75% (IQ3)$67,615$61,780
Interquartile Range (IQR)$14,892$22,129
Standard Deviation (Sample)$15,220$13,144
Standard Deviation (Population)$15,013$12,811

Similar Demographics by Householder Income Over 65 years

Demographics Similar to Kenyans by Householder Income Over 65 years

In terms of householder income over 65 years, the demographic groups most similar to Kenyans are Iraqi ($60,466, a difference of 0.080%), Czechoslovakian ($60,581, a difference of 0.11%), Celtic ($60,608, a difference of 0.15%), Immigrants from Morocco ($60,647, a difference of 0.22%), and Welsh ($60,666, a difference of 0.25%).
DemographicsRating | RankHouseholder Income Over 65 years
Spanish
45.5
/100
|
#176
Average
$60,795
Alaska Natives
44.3
/100
|
#177
Average
$60,748
Yup'ik
43.7
/100
|
#178
Average
$60,727
Welsh
42.2
/100
|
#179
Average
$60,666
Immigrants | Morocco
41.7
/100
|
#180
Average
$60,647
Celtics
40.7
/100
|
#181
Average
$60,608
Czechoslovakians
40.0
/100
|
#182
Average
$60,581
Kenyans
38.4
/100
|
#183
Fair
$60,514
Iraqis
37.2
/100
|
#184
Fair
$60,466
Albanians
32.0
/100
|
#185
Fair
$60,249
Slovenes
31.8
/100
|
#186
Fair
$60,241
Immigrants | Thailand
31.3
/100
|
#187
Fair
$60,217
Immigrants | Eritrea
28.6
/100
|
#188
Fair
$60,096
Ghanaians
27.5
/100
|
#189
Fair
$60,043
Puget Sound Salish
25.3
/100
|
#190
Fair
$59,934

Demographics Similar to Fijians by Householder Income Over 65 years

In terms of householder income over 65 years, the demographic groups most similar to Fijians are Immigrants from Laos ($56,722, a difference of 0.080%), Subsaharan African ($56,615, a difference of 0.27%), Immigrants from Panama ($56,944, a difference of 0.31%), Immigrants from Uruguay ($56,975, a difference of 0.36%), and Spanish American ($57,021, a difference of 0.45%).
DemographicsRating | RankHouseholder Income Over 65 years
Immigrants | Nonimmigrants
2.4
/100
|
#231
Tragic
$57,426
Immigrants | Venezuela
2.3
/100
|
#232
Tragic
$57,371
Immigrants | Western Africa
1.7
/100
|
#233
Tragic
$57,119
Immigrants | Burma/Myanmar
1.7
/100
|
#234
Tragic
$57,114
Spanish Americans
1.6
/100
|
#235
Tragic
$57,021
Immigrants | Uruguay
1.5
/100
|
#236
Tragic
$56,975
Immigrants | Panama
1.5
/100
|
#237
Tragic
$56,944
Fijians
1.2
/100
|
#238
Tragic
$56,768
Immigrants | Laos
1.2
/100
|
#239
Tragic
$56,722
Sub-Saharan Africans
1.0
/100
|
#240
Tragic
$56,615
Immigrants | Guyana
0.9
/100
|
#241
Tragic
$56,495
Yaqui
0.8
/100
|
#242
Tragic
$56,417
Guyanese
0.8
/100
|
#243
Tragic
$56,351
Hmong
0.8
/100
|
#244
Tragic
$56,339
Immigrants | Uzbekistan
0.8
/100
|
#245
Tragic
$56,331