Laotian vs Austrian Householder Income Ages 45 - 64 years
COMPARE
Laotian
Austrian
Householder Income Ages 45 - 64 years
Householder Income Ages 45 - 64 years Comparison
Laotians
Austrians
$111,051
HOUSEHOLDER INCOME AGES 45 - 64 YEARS
99.5/ 100
METRIC RATING
67th/ 347
METRIC RANK
$108,692
HOUSEHOLDER INCOME AGES 45 - 64 YEARS
98.5/ 100
METRIC RATING
86th/ 347
METRIC RANK
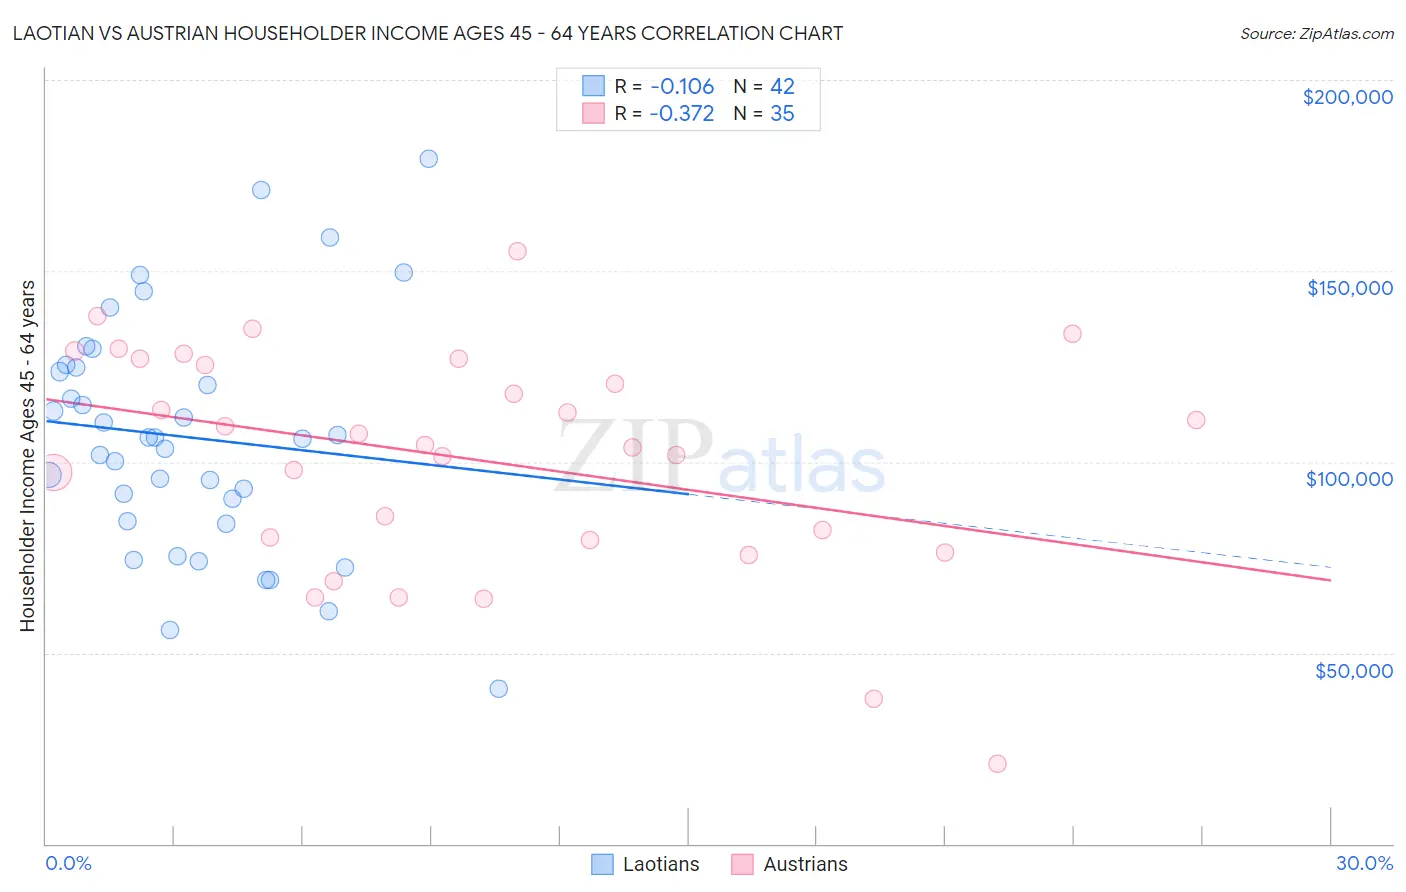
Laotian vs Austrian Householder Income Ages 45 - 64 years Correlation Chart
The statistical analysis conducted on geographies consisting of 224,613,434 people shows a poor negative correlation between the proportion of Laotians and household income with householder between the ages 45 and 64 in the United States with a correlation coefficient (R) of -0.106 and weighted average of $111,051. Similarly, the statistical analysis conducted on geographies consisting of 451,173,379 people shows a mild negative correlation between the proportion of Austrians and household income with householder between the ages 45 and 64 in the United States with a correlation coefficient (R) of -0.372 and weighted average of $108,692, a difference of 2.2%.
Householder Income Ages 45 - 64 years Correlation Summary
| Measurement | Laotian | Austrian |
| Minimum | $40,547 | $20,833 |
| Maximum | $179,286 | $155,000 |
| Range | $138,739 | $134,167 |
| Mean | $106,378 | $100,755 |
| Median | $106,231 | $104,463 |
| Interquartile 25% (IQ1) | $84,487 | $79,395 |
| Interquartile 75% (IQ3) | $124,834 | $126,954 |
| Interquartile Range (IQR) | $40,347 | $47,559 |
| Standard Deviation (Sample) | $30,879 | $29,820 |
| Standard Deviation (Population) | $30,509 | $29,391 |
Demographics Similar to Laotians and Austrians by Householder Income Ages 45 - 64 years
In terms of householder income ages 45 - 64 years, the demographic groups most similar to Laotians are New Zealander ($111,286, a difference of 0.21%), Immigrants from Romania ($110,633, a difference of 0.38%), Immigrants from Italy ($110,434, a difference of 0.56%), Korean ($110,334, a difference of 0.65%), and Italian ($110,224, a difference of 0.75%). Similarly, the demographic groups most similar to Austrians are Immigrants from Afghanistan ($108,785, a difference of 0.090%), Immigrants from Western Europe ($108,824, a difference of 0.12%), Immigrants from Spain ($109,051, a difference of 0.33%), Immigrants from North America ($109,198, a difference of 0.47%), and Immigrants from Eastern Europe ($109,335, a difference of 0.59%).
| Demographics | Rating | Rank | Householder Income Ages 45 - 64 years |
| New Zealanders | 99.6 /100 | #66 | Exceptional $111,286 |
| Laotians | 99.5 /100 | #67 | Exceptional $111,051 |
| Immigrants | Romania | 99.4 /100 | #68 | Exceptional $110,633 |
| Immigrants | Italy | 99.4 /100 | #69 | Exceptional $110,434 |
| Koreans | 99.3 /100 | #70 | Exceptional $110,334 |
| Italians | 99.3 /100 | #71 | Exceptional $110,224 |
| Assyrians/Chaldeans/Syriacs | 99.3 /100 | #72 | Exceptional $110,201 |
| Argentineans | 99.3 /100 | #73 | Exceptional $110,103 |
| Immigrants | Egypt | 99.2 /100 | #74 | Exceptional $109,941 |
| South Africans | 99.1 /100 | #75 | Exceptional $109,719 |
| Paraguayans | 99.0 /100 | #76 | Exceptional $109,447 |
| Immigrants | England | 99.0 /100 | #77 | Exceptional $109,446 |
| Immigrants | Canada | 99.0 /100 | #78 | Exceptional $109,402 |
| Immigrants | Bulgaria | 98.9 /100 | #79 | Exceptional $109,379 |
| Jordanians | 98.9 /100 | #80 | Exceptional $109,376 |
| Immigrants | Eastern Europe | 98.9 /100 | #81 | Exceptional $109,335 |
| Immigrants | North America | 98.8 /100 | #82 | Exceptional $109,198 |
| Immigrants | Spain | 98.8 /100 | #83 | Exceptional $109,051 |
| Immigrants | Western Europe | 98.6 /100 | #84 | Exceptional $108,824 |
| Immigrants | Afghanistan | 98.6 /100 | #85 | Exceptional $108,785 |
| Austrians | 98.5 /100 | #86 | Exceptional $108,692 |