Chippewa vs Taiwanese Median Family Income
COMPARE
Chippewa
Taiwanese
Median Family Income
Median Family Income Comparison
Chippewa
Taiwanese
$86,852
MEDIAN FAMILY INCOME
0.0/ 100
METRIC RATING
299th/ 347
METRIC RANK
$107,295
MEDIAN FAMILY INCOME
91.4/ 100
METRIC RATING
125th/ 347
METRIC RANK
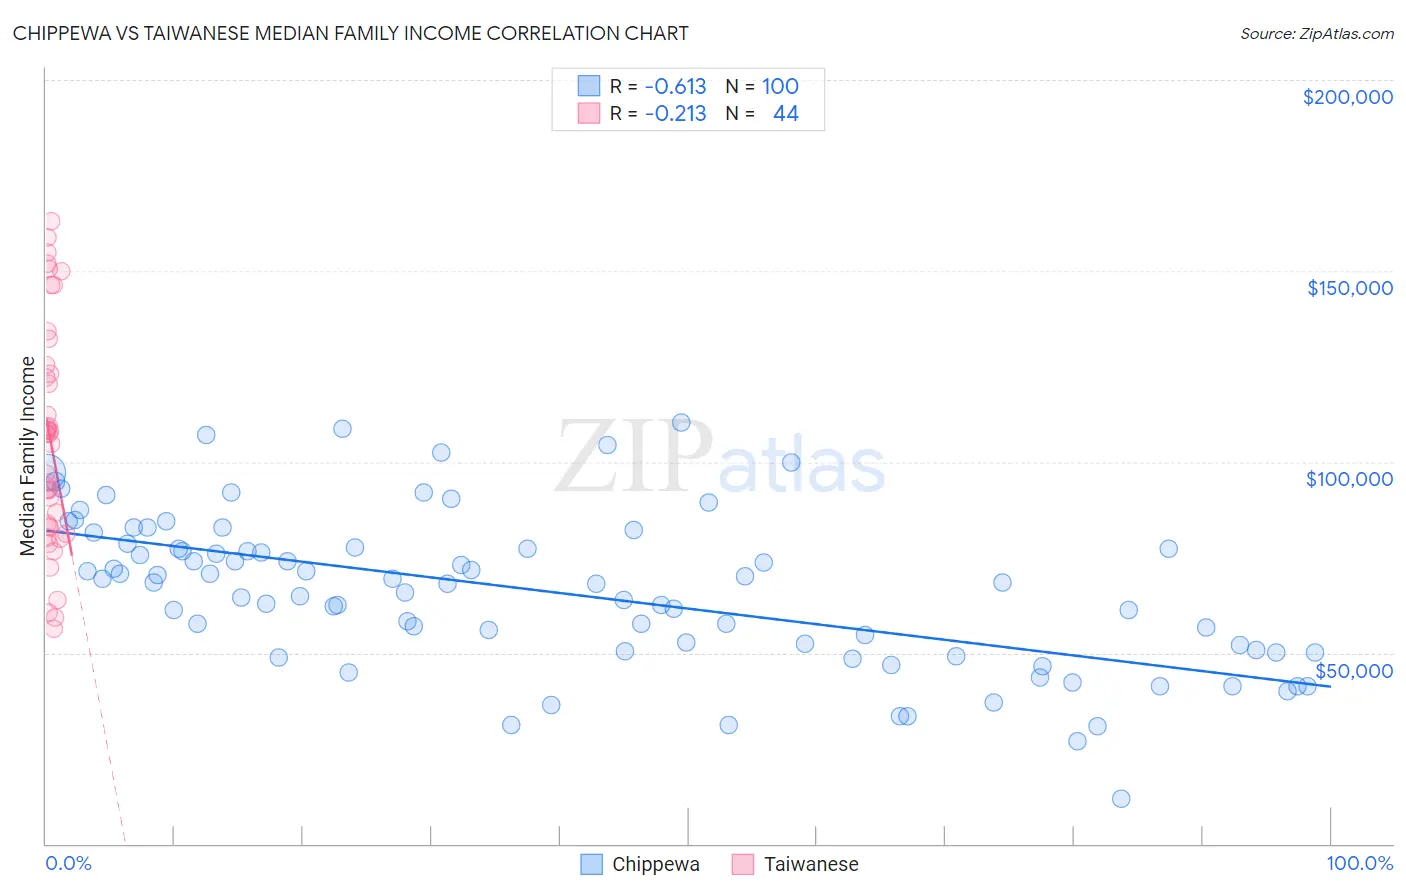
Chippewa vs Taiwanese Median Family Income Correlation Chart
The statistical analysis conducted on geographies consisting of 214,970,726 people shows a significant negative correlation between the proportion of Chippewa and median family income in the United States with a correlation coefficient (R) of -0.613 and weighted average of $86,852. Similarly, the statistical analysis conducted on geographies consisting of 31,709,765 people shows a weak negative correlation between the proportion of Taiwanese and median family income in the United States with a correlation coefficient (R) of -0.213 and weighted average of $107,295, a difference of 23.5%.
Median Family Income Correlation Summary
| Measurement | Chippewa | Taiwanese |
| Minimum | $11,667 | $56,146 |
| Maximum | $110,455 | $162,974 |
| Range | $98,788 | $106,828 |
| Mean | $65,965 | $106,094 |
| Median | $68,273 | $107,372 |
| Interquartile 25% (IQ1) | $50,598 | $83,038 |
| Interquartile 75% (IQ3) | $77,379 | $124,300 |
| Interquartile Range (IQR) | $26,781 | $41,262 |
| Standard Deviation (Sample) | $20,173 | $29,129 |
| Standard Deviation (Population) | $20,072 | $28,796 |
Similar Demographics by Median Family Income
Demographics Similar to Chippewa by Median Family Income
In terms of median family income, the demographic groups most similar to Chippewa are Immigrants from Latin America ($86,989, a difference of 0.16%), Cajun ($87,157, a difference of 0.35%), Immigrants from Guatemala ($87,191, a difference of 0.39%), Yaqui ($87,289, a difference of 0.50%), and Ottawa ($86,380, a difference of 0.55%).
| Demographics | Rating | Rank | Median Family Income |
| Africans | 0.1 /100 | #292 | Tragic $87,820 |
| Ute | 0.0 /100 | #293 | Tragic $87,596 |
| Fijians | 0.0 /100 | #294 | Tragic $87,387 |
| Yaqui | 0.0 /100 | #295 | Tragic $87,289 |
| Immigrants | Guatemala | 0.0 /100 | #296 | Tragic $87,191 |
| Cajuns | 0.0 /100 | #297 | Tragic $87,157 |
| Immigrants | Latin America | 0.0 /100 | #298 | Tragic $86,989 |
| Chippewa | 0.0 /100 | #299 | Tragic $86,852 |
| Ottawa | 0.0 /100 | #300 | Tragic $86,380 |
| Colville | 0.0 /100 | #301 | Tragic $85,792 |
| Spanish American Indians | 0.0 /100 | #302 | Tragic $85,728 |
| Hispanics or Latinos | 0.0 /100 | #303 | Tragic $85,647 |
| Mexicans | 0.0 /100 | #304 | Tragic $85,618 |
| Paiute | 0.0 /100 | #305 | Tragic $85,414 |
| Immigrants | Dominica | 0.0 /100 | #306 | Tragic $85,411 |
Demographics Similar to Taiwanese by Median Family Income
In terms of median family income, the demographic groups most similar to Taiwanese are Pakistani ($107,390, a difference of 0.090%), Serbian ($107,157, a difference of 0.13%), Carpatho Rusyn ($107,502, a difference of 0.19%), Lebanese ($107,086, a difference of 0.19%), and Immigrants from Ethiopia ($106,969, a difference of 0.30%).
| Demographics | Rating | Rank | Median Family Income |
| Ethiopians | 94.5 /100 | #118 | Exceptional $108,251 |
| Sri Lankans | 94.5 /100 | #119 | Exceptional $108,234 |
| Immigrants | Northern Africa | 94.3 /100 | #120 | Exceptional $108,161 |
| Europeans | 94.1 /100 | #121 | Exceptional $108,099 |
| Immigrants | Jordan | 92.9 /100 | #122 | Exceptional $107,715 |
| Carpatho Rusyns | 92.2 /100 | #123 | Exceptional $107,502 |
| Pakistanis | 91.7 /100 | #124 | Exceptional $107,390 |
| Taiwanese | 91.4 /100 | #125 | Exceptional $107,295 |
| Serbians | 90.8 /100 | #126 | Exceptional $107,157 |
| Lebanese | 90.5 /100 | #127 | Exceptional $107,086 |
| Immigrants | Ethiopia | 90.0 /100 | #128 | Excellent $106,969 |
| Arabs | 89.9 /100 | #129 | Excellent $106,952 |
| Brazilians | 89.8 /100 | #130 | Excellent $106,942 |
| Canadians | 88.1 /100 | #131 | Excellent $106,597 |
| Immigrants | Fiji | 87.8 /100 | #132 | Excellent $106,544 |