French American Indian vs Immigrants from Ireland Median Earnings
COMPARE
French American Indian
Immigrants from Ireland
Median Earnings
Median Earnings Comparison
French American Indians
Immigrants from Ireland
$43,333
MEDIAN EARNINGS
1.3/ 100
METRIC RATING
258th/ 347
METRIC RANK
$56,854
MEDIAN EARNINGS
100.0/ 100
METRIC RATING
12th/ 347
METRIC RANK
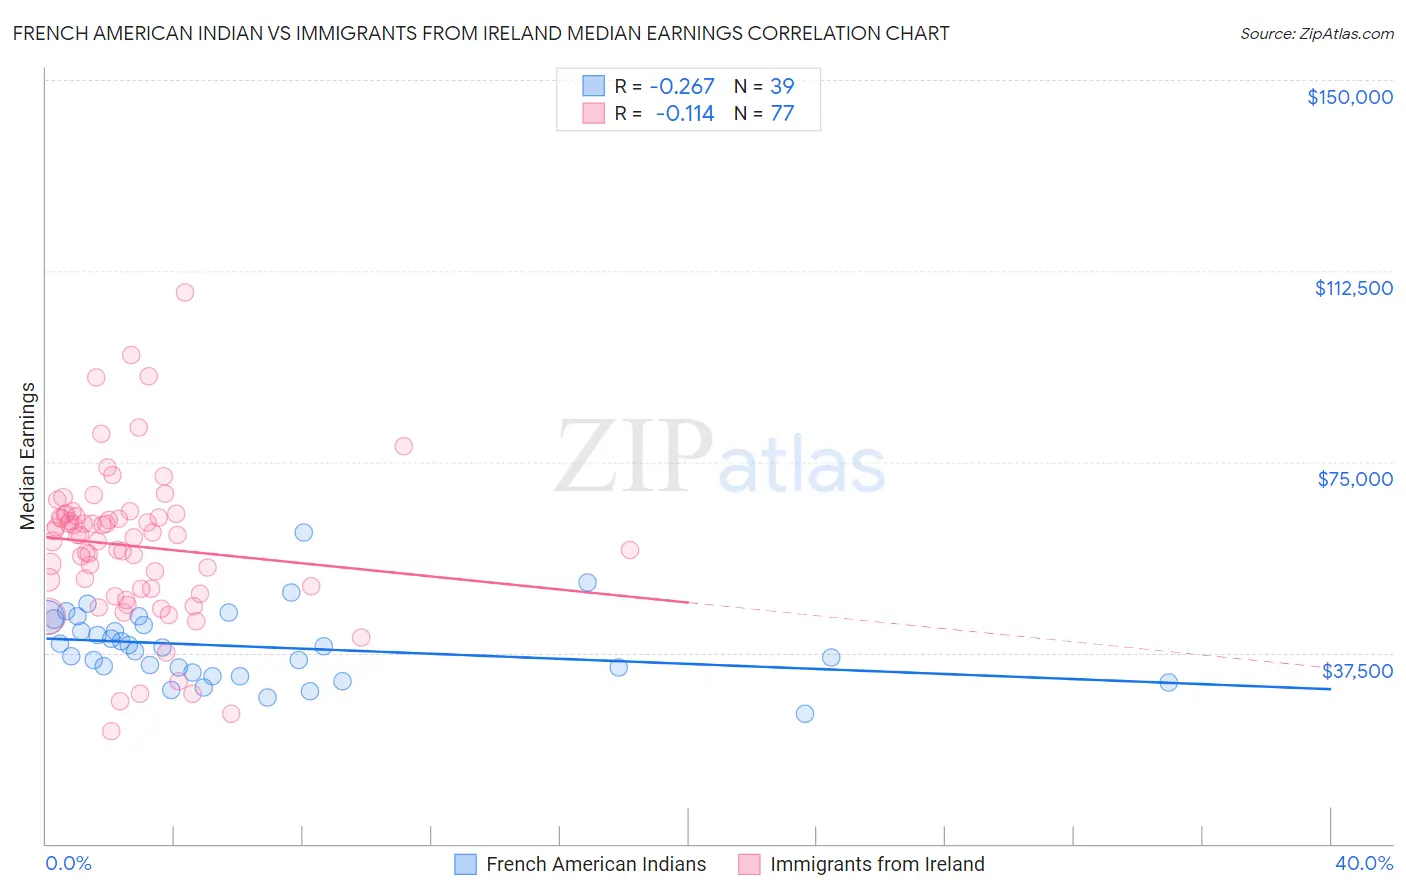
French American Indian vs Immigrants from Ireland Median Earnings Correlation Chart
The statistical analysis conducted on geographies consisting of 131,971,536 people shows a weak negative correlation between the proportion of French American Indians and median earnings in the United States with a correlation coefficient (R) of -0.267 and weighted average of $43,333. Similarly, the statistical analysis conducted on geographies consisting of 240,768,964 people shows a poor negative correlation between the proportion of Immigrants from Ireland and median earnings in the United States with a correlation coefficient (R) of -0.114 and weighted average of $56,854, a difference of 31.2%.
Median Earnings Correlation Summary
| Measurement | French American Indian | Immigrants from Ireland |
| Minimum | $25,417 | $22,198 |
| Maximum | $61,250 | $108,333 |
| Range | $35,833 | $86,135 |
| Mean | $38,746 | $58,485 |
| Median | $38,517 | $60,577 |
| Interquartile 25% (IQ1) | $33,745 | $49,600 |
| Interquartile 75% (IQ3) | $44,112 | $64,376 |
| Interquartile Range (IQR) | $10,368 | $14,776 |
| Standard Deviation (Sample) | $7,041 | $15,214 |
| Standard Deviation (Population) | $6,950 | $15,114 |
Similar Demographics by Median Earnings
Demographics Similar to French American Indians by Median Earnings
In terms of median earnings, the demographic groups most similar to French American Indians are Jamaican ($43,343, a difference of 0.020%), Alaskan Athabascan ($43,393, a difference of 0.14%), Immigrants from Middle Africa ($43,416, a difference of 0.19%), German Russian ($43,200, a difference of 0.31%), and Liberian ($43,536, a difference of 0.47%).
| Demographics | Rating | Rank | Median Earnings |
| Tsimshian | 2.1 /100 | #251 | Tragic $43,695 |
| Hawaiians | 2.0 /100 | #252 | Tragic $43,673 |
| Somalis | 1.8 /100 | #253 | Tragic $43,567 |
| Liberians | 1.7 /100 | #254 | Tragic $43,536 |
| Immigrants | Middle Africa | 1.4 /100 | #255 | Tragic $43,416 |
| Alaskan Athabascans | 1.4 /100 | #256 | Tragic $43,393 |
| Jamaicans | 1.3 /100 | #257 | Tragic $43,343 |
| French American Indians | 1.3 /100 | #258 | Tragic $43,333 |
| German Russians | 1.1 /100 | #259 | Tragic $43,200 |
| Immigrants | Somalia | 0.9 /100 | #260 | Tragic $43,100 |
| Immigrants | Jamaica | 0.8 /100 | #261 | Tragic $43,026 |
| Nicaraguans | 0.8 /100 | #262 | Tragic $43,026 |
| Inupiat | 0.8 /100 | #263 | Tragic $43,000 |
| Immigrants | Liberia | 0.7 /100 | #264 | Tragic $42,923 |
| Salvadorans | 0.7 /100 | #265 | Tragic $42,912 |
Demographics Similar to Immigrants from Ireland by Median Earnings
In terms of median earnings, the demographic groups most similar to Immigrants from Ireland are Immigrants from Israel ($57,034, a difference of 0.32%), Immigrants from China ($56,638, a difference of 0.38%), Immigrants from South Central Asia ($57,114, a difference of 0.46%), Immigrants from Australia ($56,305, a difference of 0.97%), and Indian (Asian) ($56,253, a difference of 1.1%).
| Demographics | Rating | Rank | Median Earnings |
| Thais | 100.0 /100 | #5 | Exceptional $59,237 |
| Immigrants | Singapore | 100.0 /100 | #6 | Exceptional $59,038 |
| Iranians | 100.0 /100 | #7 | Exceptional $58,474 |
| Immigrants | Iran | 100.0 /100 | #8 | Exceptional $57,612 |
| Okinawans | 100.0 /100 | #9 | Exceptional $57,550 |
| Immigrants | South Central Asia | 100.0 /100 | #10 | Exceptional $57,114 |
| Immigrants | Israel | 100.0 /100 | #11 | Exceptional $57,034 |
| Immigrants | Ireland | 100.0 /100 | #12 | Exceptional $56,854 |
| Immigrants | China | 100.0 /100 | #13 | Exceptional $56,638 |
| Immigrants | Australia | 100.0 /100 | #14 | Exceptional $56,305 |
| Indians (Asian) | 100.0 /100 | #15 | Exceptional $56,253 |
| Immigrants | Eastern Asia | 100.0 /100 | #16 | Exceptional $56,183 |
| Eastern Europeans | 100.0 /100 | #17 | Exceptional $55,084 |
| Immigrants | Japan | 100.0 /100 | #18 | Exceptional $54,938 |
| Immigrants | Belgium | 100.0 /100 | #19 | Exceptional $54,679 |