Arapaho vs Maltese Householder Income Ages 25 - 44 years
COMPARE
Arapaho
Maltese
Householder Income Ages 25 - 44 years
Householder Income Ages 25 - 44 years Comparison
Arapaho
Maltese
$71,697
HOUSEHOLDER INCOME AGES 25 - 44 YEARS
0.0/ 100
METRIC RATING
341st/ 347
METRIC RANK
$110,064
HOUSEHOLDER INCOME AGES 25 - 44 YEARS
100.0/ 100
METRIC RATING
31st/ 347
METRIC RANK
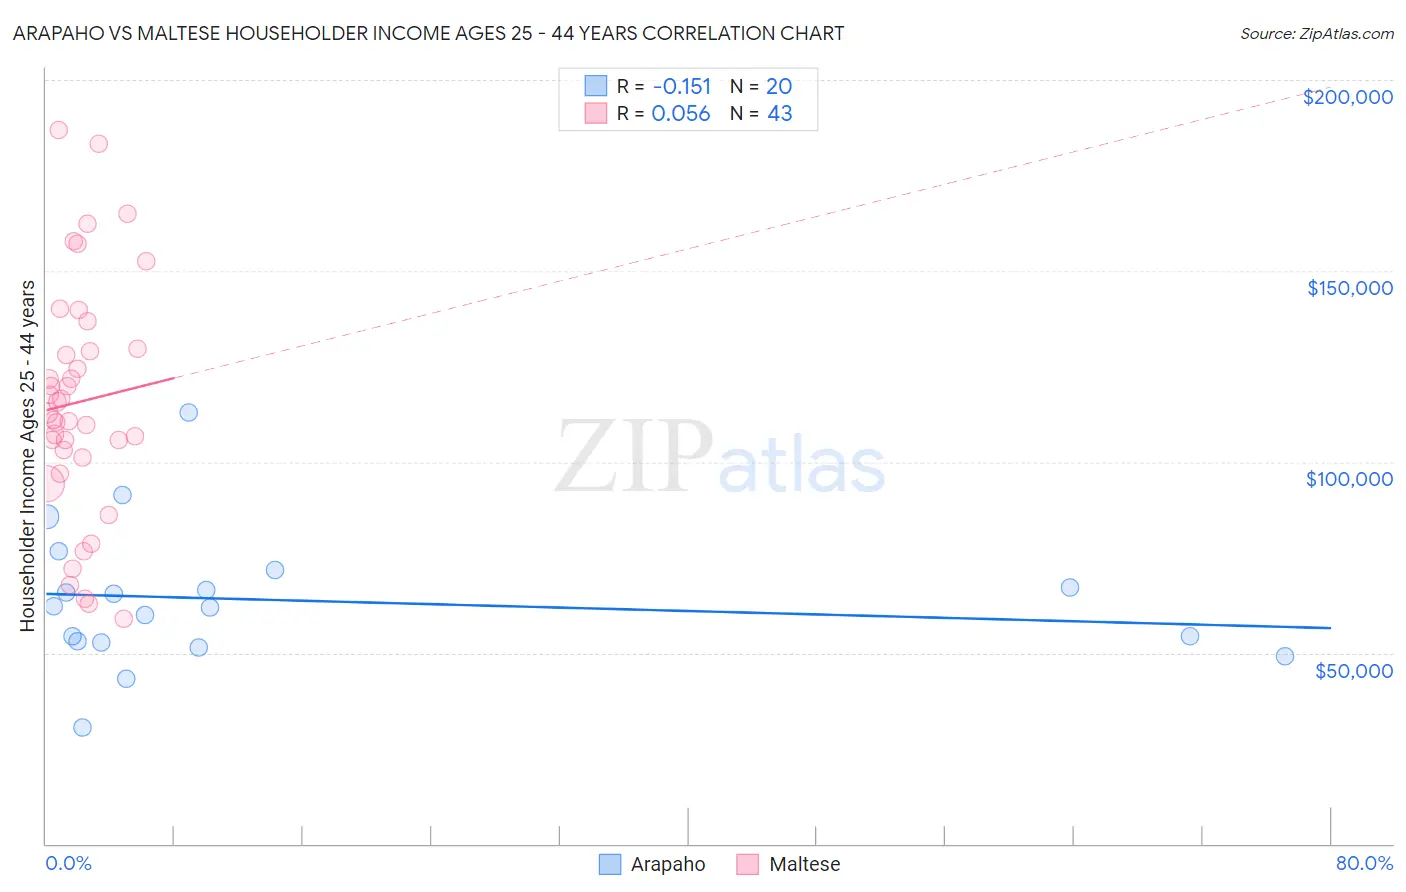
Arapaho vs Maltese Householder Income Ages 25 - 44 years Correlation Chart
The statistical analysis conducted on geographies consisting of 29,750,009 people shows a poor negative correlation between the proportion of Arapaho and household income with householder between the ages 25 and 44 in the United States with a correlation coefficient (R) of -0.151 and weighted average of $71,697. Similarly, the statistical analysis conducted on geographies consisting of 126,133,875 people shows a slight positive correlation between the proportion of Maltese and household income with householder between the ages 25 and 44 in the United States with a correlation coefficient (R) of 0.056 and weighted average of $110,064, a difference of 53.5%.
Householder Income Ages 25 - 44 years Correlation Summary
| Measurement | Arapaho | Maltese |
| Minimum | $30,478 | $58,867 |
| Maximum | $113,036 | $186,969 |
| Range | $82,558 | $128,102 |
| Mean | $63,768 | $115,666 |
| Median | $62,022 | $112,847 |
| Interquartile 25% (IQ1) | $52,738 | $101,168 |
| Interquartile 75% (IQ3) | $69,428 | $129,763 |
| Interquartile Range (IQR) | $16,690 | $28,595 |
| Standard Deviation (Sample) | $18,151 | $30,812 |
| Standard Deviation (Population) | $17,692 | $30,451 |
Similar Demographics by Householder Income Ages 25 - 44 years
Demographics Similar to Arapaho by Householder Income Ages 25 - 44 years
In terms of householder income ages 25 - 44 years, the demographic groups most similar to Arapaho are Crow ($71,337, a difference of 0.50%), Immigrants from Congo ($72,178, a difference of 0.67%), Yuman ($72,956, a difference of 1.8%), Immigrants from Yemen ($73,043, a difference of 1.9%), and Black/African American ($73,370, a difference of 2.3%).
| Demographics | Rating | Rank | Householder Income Ages 25 - 44 years |
| Hopi | 0.0 /100 | #333 | Tragic $75,002 |
| Creek | 0.0 /100 | #334 | Tragic $74,847 |
| Kiowa | 0.0 /100 | #335 | Tragic $74,776 |
| Yup'ik | 0.0 /100 | #336 | Tragic $73,688 |
| Blacks/African Americans | 0.0 /100 | #337 | Tragic $73,370 |
| Immigrants | Yemen | 0.0 /100 | #338 | Tragic $73,043 |
| Yuman | 0.0 /100 | #339 | Tragic $72,956 |
| Immigrants | Congo | 0.0 /100 | #340 | Tragic $72,178 |
| Arapaho | 0.0 /100 | #341 | Tragic $71,697 |
| Crow | 0.0 /100 | #342 | Tragic $71,337 |
| Tohono O'odham | 0.0 /100 | #343 | Tragic $69,068 |
| Pueblo | 0.0 /100 | #344 | Tragic $68,910 |
| Navajo | 0.0 /100 | #345 | Tragic $66,529 |
| Puerto Ricans | 0.0 /100 | #346 | Tragic $65,996 |
| Lumbee | 0.0 /100 | #347 | Tragic $60,305 |
Demographics Similar to Maltese by Householder Income Ages 25 - 44 years
In terms of householder income ages 25 - 44 years, the demographic groups most similar to Maltese are Immigrants from Greece ($110,103, a difference of 0.040%), Turkish ($110,318, a difference of 0.23%), Immigrants from Denmark ($110,363, a difference of 0.27%), Immigrants from Sri Lanka ($109,741, a difference of 0.29%), and Russian ($110,398, a difference of 0.30%).
| Demographics | Rating | Rank | Householder Income Ages 25 - 44 years |
| Immigrants | Sweden | 100.0 /100 | #24 | Exceptional $112,010 |
| Immigrants | Northern Europe | 100.0 /100 | #25 | Exceptional $111,676 |
| Immigrants | Asia | 100.0 /100 | #26 | Exceptional $110,787 |
| Russians | 100.0 /100 | #27 | Exceptional $110,398 |
| Immigrants | Denmark | 100.0 /100 | #28 | Exceptional $110,363 |
| Turks | 100.0 /100 | #29 | Exceptional $110,318 |
| Immigrants | Greece | 100.0 /100 | #30 | Exceptional $110,103 |
| Maltese | 100.0 /100 | #31 | Exceptional $110,064 |
| Immigrants | Sri Lanka | 100.0 /100 | #32 | Exceptional $109,741 |
| Bhutanese | 100.0 /100 | #33 | Exceptional $109,520 |
| Bolivians | 100.0 /100 | #34 | Exceptional $109,372 |
| Immigrants | Switzerland | 100.0 /100 | #35 | Exceptional $109,185 |
| Latvians | 100.0 /100 | #36 | Exceptional $108,926 |
| Immigrants | Russia | 100.0 /100 | #37 | Exceptional $108,751 |
| Soviet Union | 100.0 /100 | #38 | Exceptional $108,457 |