Sierra Leonean vs Immigrants from South Eastern Asia Median Female Earnings
COMPARE
Sierra Leonean
Immigrants from South Eastern Asia
Median Female Earnings
Median Female Earnings Comparison
Sierra Leoneans
Immigrants from South Eastern Asia
$42,868
MEDIAN FEMALE EARNINGS
99.9/ 100
METRIC RATING
65th/ 347
METRIC RANK
$40,558
MEDIAN FEMALE EARNINGS
85.7/ 100
METRIC RATING
139th/ 347
METRIC RANK
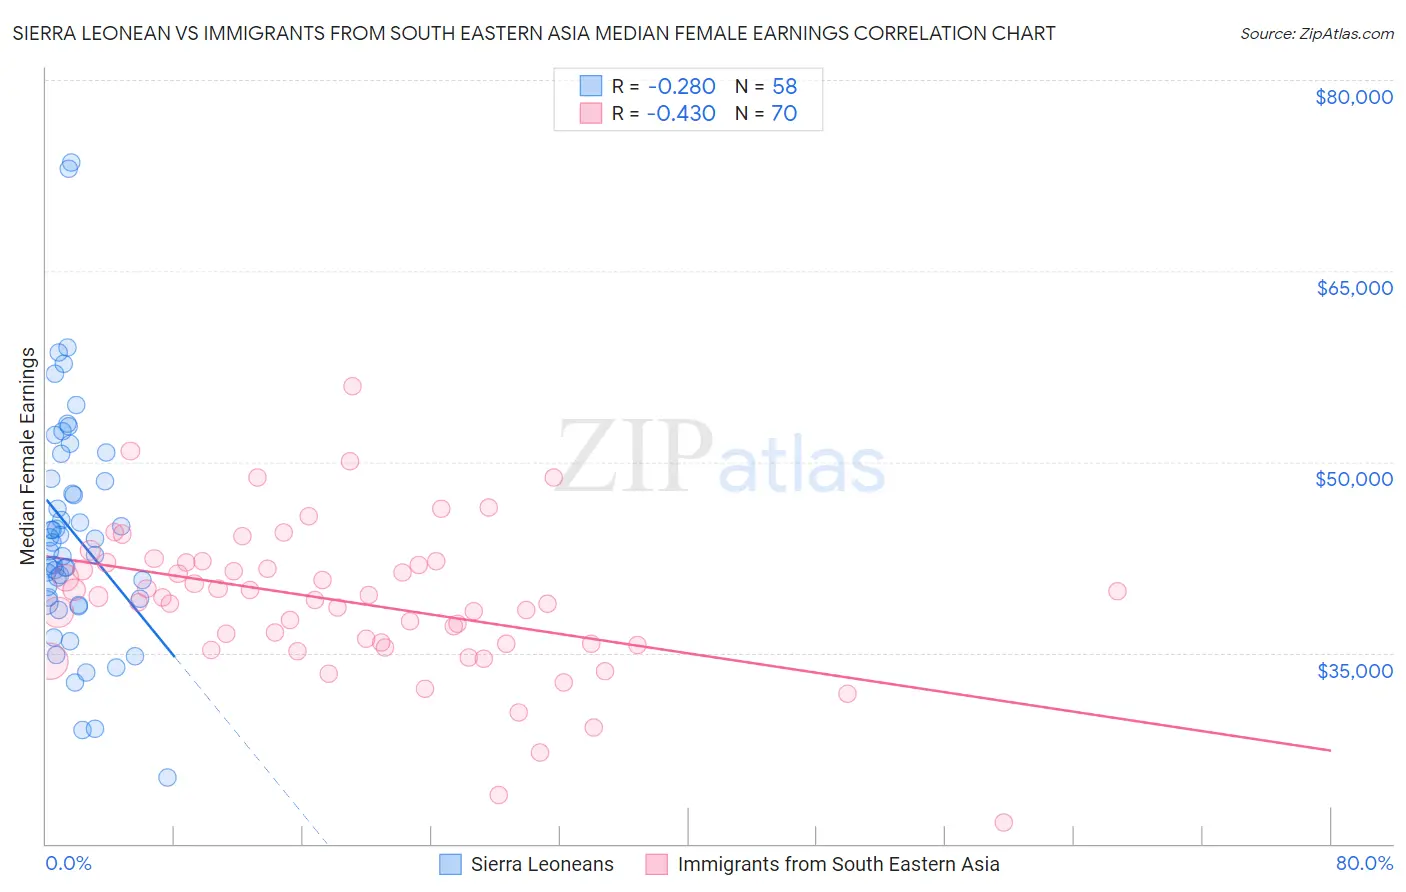
Sierra Leonean vs Immigrants from South Eastern Asia Median Female Earnings Correlation Chart
The statistical analysis conducted on geographies consisting of 83,345,835 people shows a weak negative correlation between the proportion of Sierra Leoneans and median female earnings in the United States with a correlation coefficient (R) of -0.280 and weighted average of $42,868. Similarly, the statistical analysis conducted on geographies consisting of 512,224,211 people shows a moderate negative correlation between the proportion of Immigrants from South Eastern Asia and median female earnings in the United States with a correlation coefficient (R) of -0.430 and weighted average of $40,558, a difference of 5.7%.
Median Female Earnings Correlation Summary
| Measurement | Sierra Leonean | Immigrants from South Eastern Asia |
| Minimum | $25,167 | $21,667 |
| Maximum | $73,523 | $55,907 |
| Range | $48,356 | $34,240 |
| Mean | $44,483 | $38,991 |
| Median | $43,304 | $39,248 |
| Interquartile 25% (IQ1) | $39,290 | $35,697 |
| Interquartile 75% (IQ3) | $48,705 | $42,089 |
| Interquartile Range (IQR) | $9,415 | $6,392 |
| Standard Deviation (Sample) | $9,174 | $5,838 |
| Standard Deviation (Population) | $9,094 | $5,797 |
Similar Demographics by Median Female Earnings
Demographics Similar to Sierra Leoneans by Median Female Earnings
In terms of median female earnings, the demographic groups most similar to Sierra Leoneans are Immigrants from Norway ($42,837, a difference of 0.070%), Immigrants from Egypt ($42,837, a difference of 0.070%), Immigrants from Austria ($42,824, a difference of 0.10%), Immigrants from Spain ($42,815, a difference of 0.12%), and Immigrants from Ethiopia ($42,744, a difference of 0.29%).
| Demographics | Rating | Rank | Median Female Earnings |
| Paraguayans | 99.9 /100 | #58 | Exceptional $43,173 |
| Estonians | 99.9 /100 | #59 | Exceptional $43,106 |
| Immigrants | Latvia | 99.9 /100 | #60 | Exceptional $43,099 |
| Immigrants | Bulgaria | 99.9 /100 | #61 | Exceptional $43,085 |
| Afghans | 99.9 /100 | #62 | Exceptional $43,077 |
| Immigrants | Ukraine | 99.9 /100 | #63 | Exceptional $43,069 |
| Immigrants | Pakistan | 99.9 /100 | #64 | Exceptional $43,052 |
| Sierra Leoneans | 99.9 /100 | #65 | Exceptional $42,868 |
| Immigrants | Norway | 99.9 /100 | #66 | Exceptional $42,837 |
| Immigrants | Egypt | 99.9 /100 | #67 | Exceptional $42,837 |
| Immigrants | Austria | 99.8 /100 | #68 | Exceptional $42,824 |
| Immigrants | Spain | 99.8 /100 | #69 | Exceptional $42,815 |
| Immigrants | Ethiopia | 99.8 /100 | #70 | Exceptional $42,744 |
| Immigrants | Romania | 99.8 /100 | #71 | Exceptional $42,718 |
| Albanians | 99.8 /100 | #72 | Exceptional $42,584 |
Demographics Similar to Immigrants from South Eastern Asia by Median Female Earnings
In terms of median female earnings, the demographic groups most similar to Immigrants from South Eastern Asia are Taiwanese ($40,576, a difference of 0.040%), Serbian ($40,539, a difference of 0.050%), Pakistani ($40,596, a difference of 0.090%), Immigrants from Syria ($40,499, a difference of 0.15%), and Sri Lankan ($40,496, a difference of 0.15%).
| Demographics | Rating | Rank | Median Female Earnings |
| Immigrants | Uganda | 89.7 /100 | #132 | Excellent $40,739 |
| Syrians | 89.5 /100 | #133 | Excellent $40,727 |
| Arabs | 89.3 /100 | #134 | Excellent $40,718 |
| Immigrants | Nepal | 89.0 /100 | #135 | Excellent $40,704 |
| Immigrants | Eastern Africa | 87.7 /100 | #136 | Excellent $40,644 |
| Pakistanis | 86.6 /100 | #137 | Excellent $40,596 |
| Taiwanese | 86.1 /100 | #138 | Excellent $40,576 |
| Immigrants | South Eastern Asia | 85.7 /100 | #139 | Excellent $40,558 |
| Serbians | 85.2 /100 | #140 | Excellent $40,539 |
| Immigrants | Syria | 84.1 /100 | #141 | Excellent $40,499 |
| Sri Lankans | 84.0 /100 | #142 | Excellent $40,496 |
| Northern Europeans | 83.9 /100 | #143 | Excellent $40,491 |
| Immigrants | North Macedonia | 83.8 /100 | #144 | Excellent $40,488 |
| Brazilians | 83.6 /100 | #145 | Excellent $40,483 |
| Ghanaians | 82.1 /100 | #146 | Excellent $40,429 |