Ukrainian vs Immigrants from Northern Africa Median Household Income
COMPARE
Ukrainian
Immigrants from Northern Africa
Median Household Income
Median Household Income Comparison
Ukrainians
Immigrants from Northern Africa
$91,456
MEDIAN HOUSEHOLD INCOME
98.3/ 100
METRIC RATING
100th/ 347
METRIC RANK
$90,026
MEDIAN HOUSEHOLD INCOME
95.9/ 100
METRIC RATING
114th/ 347
METRIC RANK
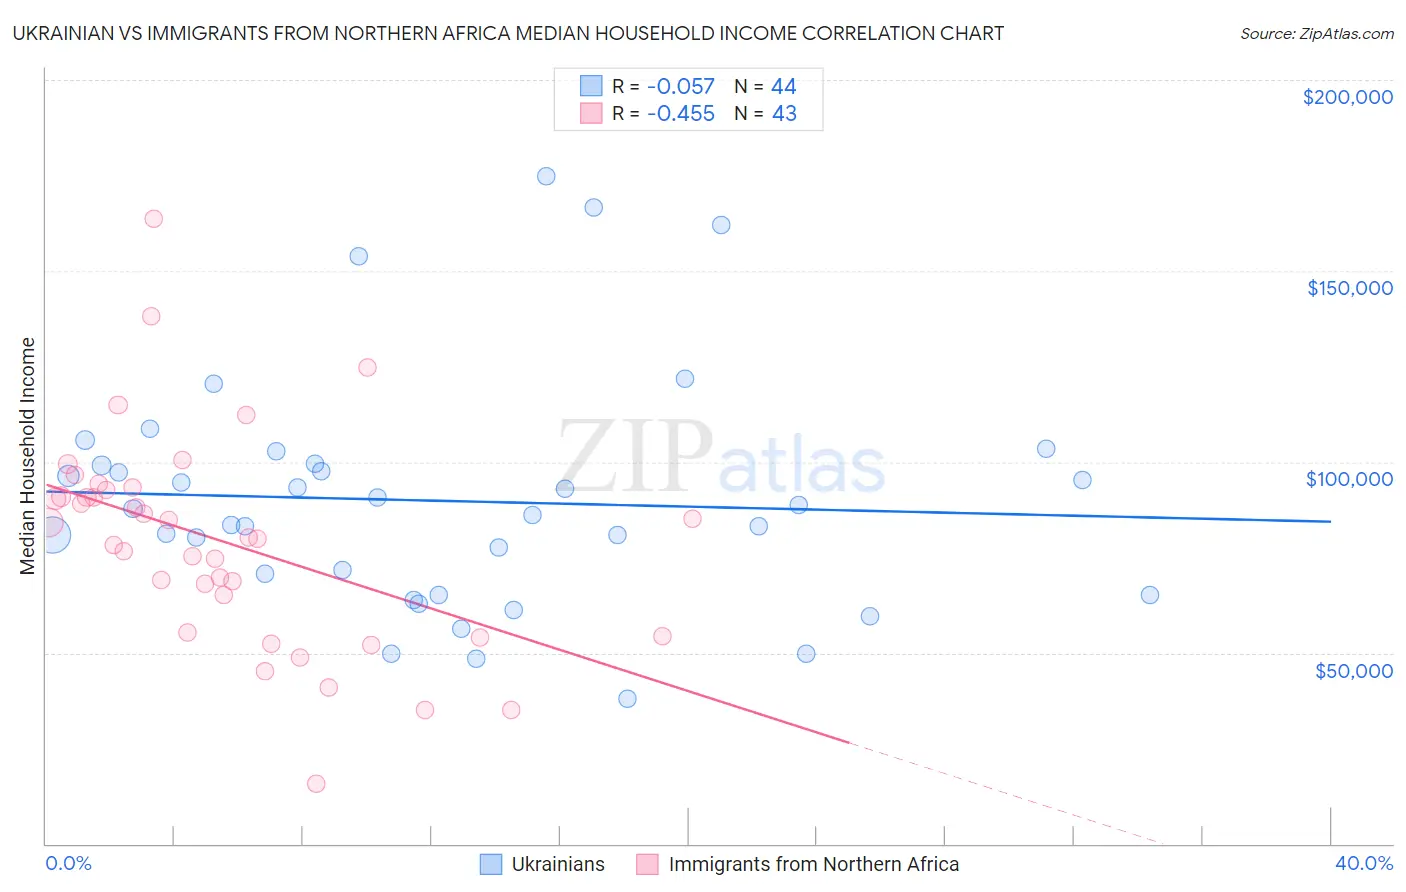
Ukrainian vs Immigrants from Northern Africa Median Household Income Correlation Chart
The statistical analysis conducted on geographies consisting of 448,198,646 people shows a slight negative correlation between the proportion of Ukrainians and median household income in the United States with a correlation coefficient (R) of -0.057 and weighted average of $91,456. Similarly, the statistical analysis conducted on geographies consisting of 321,059,386 people shows a moderate negative correlation between the proportion of Immigrants from Northern Africa and median household income in the United States with a correlation coefficient (R) of -0.455 and weighted average of $90,026, a difference of 1.6%.
Median Household Income Correlation Summary
| Measurement | Ukrainian | Immigrants from Northern Africa |
| Minimum | $37,811 | $15,682 |
| Maximum | $174,670 | $163,611 |
| Range | $136,859 | $147,929 |
| Mean | $89,793 | $79,183 |
| Median | $86,791 | $80,044 |
| Interquartile 25% (IQ1) | $67,812 | $55,170 |
| Interquartile 75% (IQ3) | $99,299 | $92,628 |
| Interquartile Range (IQR) | $31,486 | $37,458 |
| Standard Deviation (Sample) | $30,572 | $28,084 |
| Standard Deviation (Population) | $30,223 | $27,755 |
Demographics Similar to Ukrainians and Immigrants from Northern Africa by Median Household Income
In terms of median household income, the demographic groups most similar to Ukrainians are Immigrants from Moldova ($91,446, a difference of 0.010%), Immigrants from South Eastern Asia ($91,541, a difference of 0.090%), Austrian ($91,339, a difference of 0.13%), Immigrants from Southern Europe ($91,605, a difference of 0.16%), and Immigrants from Serbia ($91,730, a difference of 0.30%). Similarly, the demographic groups most similar to Immigrants from Northern Africa are Immigrants from Western Asia ($90,005, a difference of 0.020%), Native Hawaiian ($89,919, a difference of 0.12%), Taiwanese ($89,900, a difference of 0.14%), Peruvian ($90,261, a difference of 0.26%), and Northern European ($90,446, a difference of 0.47%).
| Demographics | Rating | Rank | Median Household Income |
| Immigrants | Serbia | 98.6 /100 | #97 | Exceptional $91,730 |
| Immigrants | Southern Europe | 98.5 /100 | #98 | Exceptional $91,605 |
| Immigrants | South Eastern Asia | 98.4 /100 | #99 | Exceptional $91,541 |
| Ukrainians | 98.3 /100 | #100 | Exceptional $91,456 |
| Immigrants | Moldova | 98.3 /100 | #101 | Exceptional $91,446 |
| Austrians | 98.2 /100 | #102 | Exceptional $91,339 |
| Immigrants | Ukraine | 98.0 /100 | #103 | Exceptional $91,124 |
| Immigrants | Kazakhstan | 97.8 /100 | #104 | Exceptional $91,015 |
| Immigrants | Brazil | 97.7 /100 | #105 | Exceptional $90,907 |
| Macedonians | 97.4 /100 | #106 | Exceptional $90,761 |
| Croatians | 97.3 /100 | #107 | Exceptional $90,685 |
| Zimbabweans | 97.2 /100 | #108 | Exceptional $90,618 |
| Chileans | 97.2 /100 | #109 | Exceptional $90,605 |
| Palestinians | 97.1 /100 | #110 | Exceptional $90,574 |
| Immigrants | Poland | 97.1 /100 | #111 | Exceptional $90,549 |
| Northern Europeans | 96.9 /100 | #112 | Exceptional $90,446 |
| Peruvians | 96.5 /100 | #113 | Exceptional $90,261 |
| Immigrants | Northern Africa | 95.9 /100 | #114 | Exceptional $90,026 |
| Immigrants | Western Asia | 95.9 /100 | #115 | Exceptional $90,005 |
| Native Hawaiians | 95.7 /100 | #116 | Exceptional $89,919 |
| Taiwanese | 95.6 /100 | #117 | Exceptional $89,900 |