Immigrants vs German Householder Income Over 65 years
COMPARE
Immigrants
German
Householder Income Over 65 years
Householder Income Over 65 years Comparison
Immigrants
Germans
$59,656
HOUSEHOLDER INCOME OVER 65 YEARS
20.2/ 100
METRIC RATING
199th/ 347
METRIC RANK
$59,730
HOUSEHOLDER INCOME OVER 65 YEARS
21.5/ 100
METRIC RATING
196th/ 347
METRIC RANK
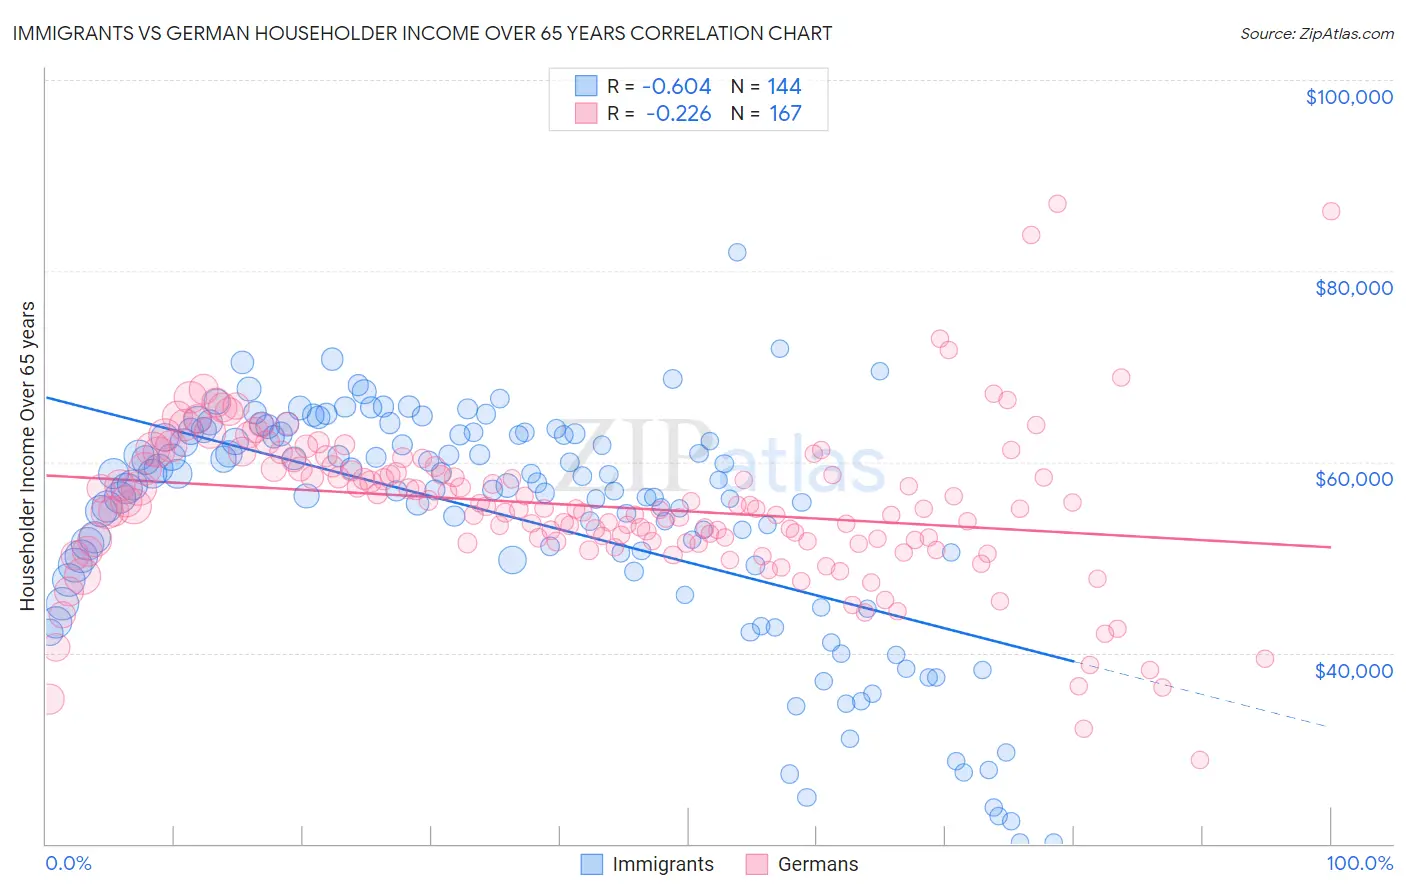
Immigrants vs German Householder Income Over 65 years Correlation Chart
The statistical analysis conducted on geographies consisting of 571,696,580 people shows a significant negative correlation between the proportion of Immigrants and household income with householder over the age of 65 in the United States with a correlation coefficient (R) of -0.604 and weighted average of $59,656. Similarly, the statistical analysis conducted on geographies consisting of 574,269,506 people shows a weak negative correlation between the proportion of Germans and household income with householder over the age of 65 in the United States with a correlation coefficient (R) of -0.226 and weighted average of $59,730, a difference of 0.12%.
Householder Income Over 65 years Correlation Summary
| Measurement | Immigrants | German |
| Minimum | $20,075 | $28,750 |
| Maximum | $81,974 | $86,983 |
| Range | $61,899 | $58,233 |
| Mean | $54,149 | $55,396 |
| Median | $57,563 | $55,057 |
| Interquartile 25% (IQ1) | $49,162 | $51,633 |
| Interquartile 75% (IQ3) | $62,877 | $59,523 |
| Interquartile Range (IQR) | $13,715 | $7,890 |
| Standard Deviation (Sample) | $12,348 | $8,316 |
| Standard Deviation (Population) | $12,305 | $8,291 |
Demographics Similar to Immigrants and Germans by Householder Income Over 65 years
In terms of householder income over 65 years, the demographic groups most similar to Immigrants are French ($59,656, a difference of 0.0%), Moroccan ($59,683, a difference of 0.050%), Immigrants from Kenya ($59,710, a difference of 0.090%), Dutch ($59,539, a difference of 0.20%), and Finnish ($59,535, a difference of 0.20%). Similarly, the demographic groups most similar to Germans are Immigrants from Kenya ($59,710, a difference of 0.030%), Moroccan ($59,683, a difference of 0.080%), French ($59,656, a difference of 0.12%), Immigrants from Iraq ($59,824, a difference of 0.16%), and Immigrants from Africa ($59,837, a difference of 0.18%).
| Demographics | Rating | Rank | Householder Income Over 65 years |
| Immigrants | Thailand | 31.3 /100 | #187 | Fair $60,217 |
| Immigrants | Eritrea | 28.6 /100 | #188 | Fair $60,096 |
| Ghanaians | 27.5 /100 | #189 | Fair $60,043 |
| Puget Sound Salish | 25.3 /100 | #190 | Fair $59,934 |
| Belgians | 24.9 /100 | #191 | Fair $59,915 |
| South Americans | 23.8 /100 | #192 | Fair $59,854 |
| Immigrants | Costa Rica | 23.6 /100 | #193 | Fair $59,848 |
| Immigrants | Africa | 23.4 /100 | #194 | Fair $59,837 |
| Immigrants | Iraq | 23.2 /100 | #195 | Fair $59,824 |
| Germans | 21.5 /100 | #196 | Fair $59,730 |
| Immigrants | Kenya | 21.1 /100 | #197 | Fair $59,710 |
| Moroccans | 20.7 /100 | #198 | Fair $59,683 |
| Immigrants | Immigrants | 20.2 /100 | #199 | Fair $59,656 |
| French | 20.2 /100 | #200 | Fair $59,656 |
| Dutch | 18.3 /100 | #201 | Poor $59,539 |
| Finns | 18.2 /100 | #202 | Poor $59,535 |
| Scotch-Irish | 16.9 /100 | #203 | Poor $59,447 |
| Arapaho | 16.0 /100 | #204 | Poor $59,383 |
| Immigrants | Sudan | 14.2 /100 | #205 | Poor $59,248 |
| Immigrants | South America | 13.0 /100 | #206 | Poor $59,151 |
| Salvadorans | 12.9 /100 | #207 | Poor $59,141 |