Swedish vs Immigrants from Cambodia Householder Income Under 25 years
COMPARE
Swedish
Immigrants from Cambodia
Householder Income Under 25 years
Householder Income Under 25 years Comparison
Swedes
Immigrants from Cambodia
$52,986
HOUSEHOLDER INCOME UNDER 25 YEARS
87.5/ 100
METRIC RATING
143rd/ 347
METRIC RANK
$52,450
HOUSEHOLDER INCOME UNDER 25 YEARS
65.4/ 100
METRIC RATING
162nd/ 347
METRIC RANK
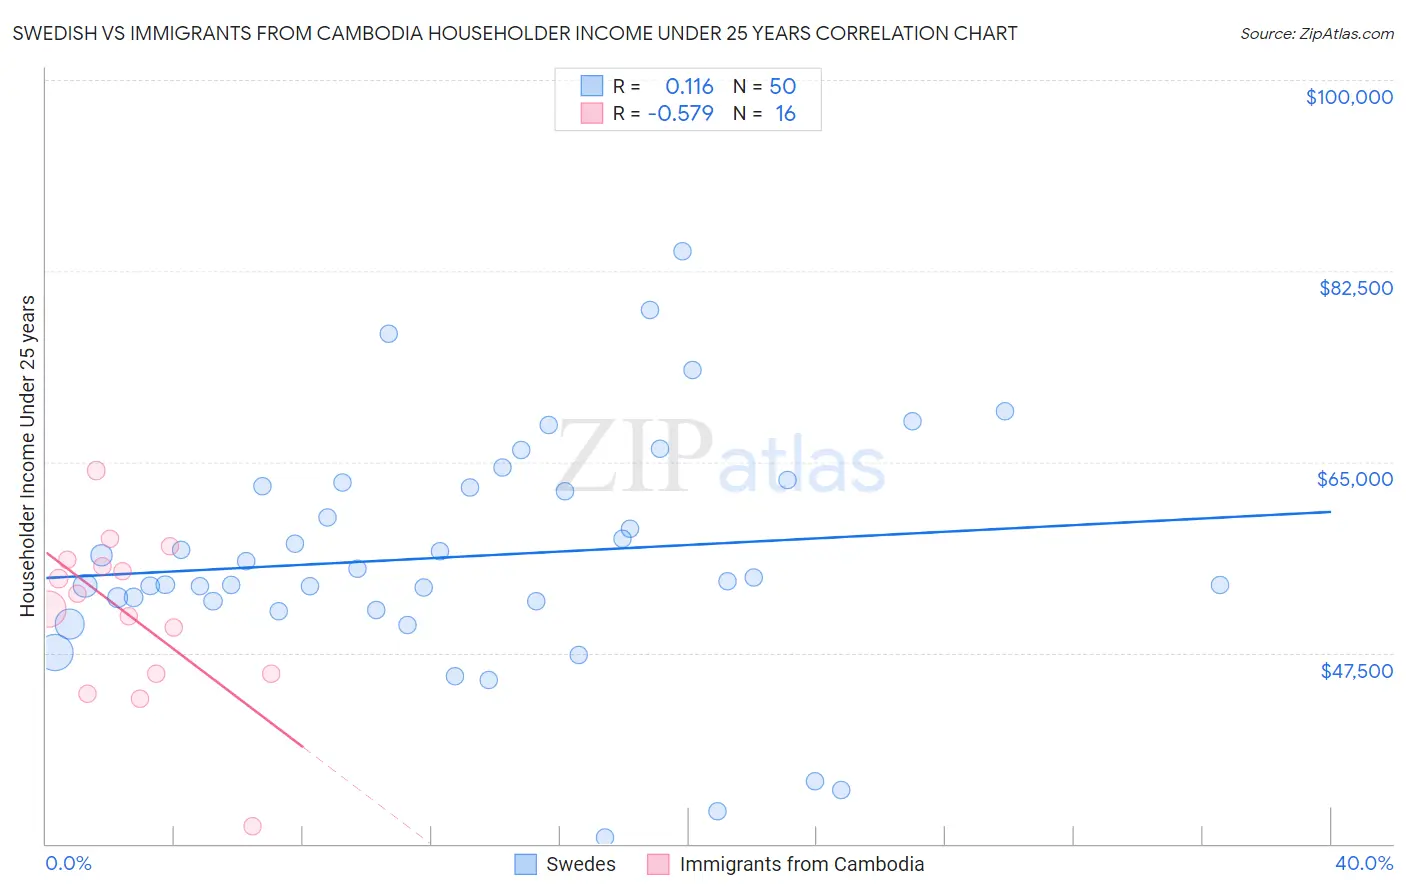
Swedish vs Immigrants from Cambodia Householder Income Under 25 years Correlation Chart
The statistical analysis conducted on geographies consisting of 422,891,046 people shows a poor positive correlation between the proportion of Swedes and household income with householder under the age of 25 in the United States with a correlation coefficient (R) of 0.116 and weighted average of $52,986. Similarly, the statistical analysis conducted on geographies consisting of 184,076,569 people shows a substantial negative correlation between the proportion of Immigrants from Cambodia and household income with householder under the age of 25 in the United States with a correlation coefficient (R) of -0.579 and weighted average of $52,450, a difference of 1.0%.
Householder Income Under 25 years Correlation Summary
| Measurement | Swedish | Immigrants from Cambodia |
| Minimum | $30,603 | $31,569 |
| Maximum | $84,275 | $64,198 |
| Range | $53,673 | $32,629 |
| Mean | $56,322 | $50,948 |
| Median | $54,225 | $52,234 |
| Interquartile 25% (IQ1) | $52,194 | $45,586 |
| Interquartile 75% (IQ3) | $62,766 | $55,713 |
| Interquartile Range (IQR) | $10,572 | $10,127 |
| Standard Deviation (Sample) | $10,808 | $7,692 |
| Standard Deviation (Population) | $10,700 | $7,448 |
Demographics Similar to Swedes and Immigrants from Cambodia by Householder Income Under 25 years
In terms of householder income under 25 years, the demographic groups most similar to Swedes are Immigrants from Armenia ($52,986, a difference of 0.0%), South American Indian ($52,979, a difference of 0.010%), Immigrants from Western Europe ($52,957, a difference of 0.050%), Immigrants from Hungary ($52,798, a difference of 0.36%), and Latvian ($52,783, a difference of 0.38%). Similarly, the demographic groups most similar to Immigrants from Cambodia are Uruguayan ($52,465, a difference of 0.030%), Immigrants from Turkey ($52,503, a difference of 0.10%), Mongolian ($52,540, a difference of 0.17%), Ghanaian ($52,594, a difference of 0.27%), and Immigrants from Netherlands ($52,592, a difference of 0.27%).
| Demographics | Rating | Rank | Householder Income Under 25 years |
| Immigrants | Armenia | 87.5 /100 | #142 | Excellent $52,986 |
| Swedes | 87.5 /100 | #143 | Excellent $52,986 |
| South American Indians | 87.3 /100 | #144 | Excellent $52,979 |
| Immigrants | Western Europe | 86.7 /100 | #145 | Excellent $52,957 |
| Immigrants | Hungary | 81.6 /100 | #146 | Excellent $52,798 |
| Latvians | 81.0 /100 | #147 | Excellent $52,783 |
| French Canadians | 76.5 /100 | #148 | Good $52,672 |
| Scandinavians | 75.7 /100 | #149 | Good $52,654 |
| Immigrants | Costa Rica | 75.2 /100 | #150 | Good $52,643 |
| Immigrants | Scotland | 75.0 /100 | #151 | Good $52,638 |
| Trinidadians and Tobagonians | 74.6 /100 | #152 | Good $52,631 |
| Central Americans | 74.4 /100 | #153 | Good $52,626 |
| Immigrants | Azores | 74.2 /100 | #154 | Good $52,621 |
| Immigrants | Denmark | 73.8 /100 | #155 | Good $52,612 |
| Immigrants | Nepal | 73.7 /100 | #156 | Good $52,611 |
| Ghanaians | 72.9 /100 | #157 | Good $52,594 |
| Immigrants | Netherlands | 72.8 /100 | #158 | Good $52,592 |
| Mongolians | 70.2 /100 | #159 | Good $52,540 |
| Immigrants | Turkey | 68.3 /100 | #160 | Good $52,503 |
| Uruguayans | 66.2 /100 | #161 | Good $52,465 |
| Immigrants | Cambodia | 65.4 /100 | #162 | Good $52,450 |