Seminole vs Swedish Unemployment Among Ages 45 to 54 years
COMPARE
Seminole
Swedish
Unemployment Among Ages 45 to 54 years
Unemployment Among Ages 45 to 54 years Comparison
Seminole
Swedes
4.8%
UNEMPLOYMENT AMONG AGES 45 TO 54 YEARS
1.1/ 100
METRIC RATING
244th/ 347
METRIC RANK
4.0%
UNEMPLOYMENT AMONG AGES 45 TO 54 YEARS
100.0/ 100
METRIC RATING
12th/ 347
METRIC RANK
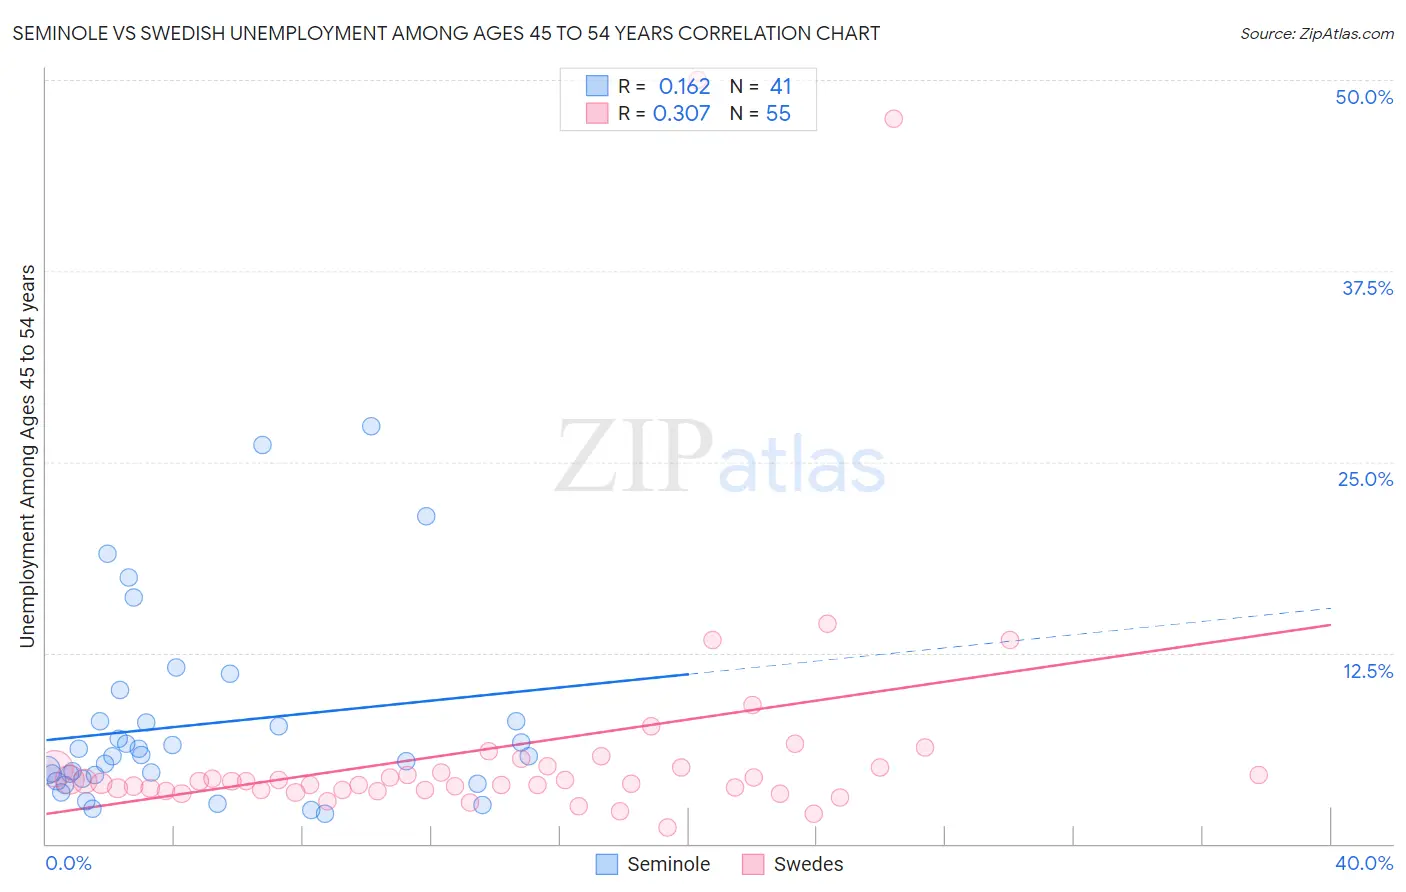
Seminole vs Swedish Unemployment Among Ages 45 to 54 years Correlation Chart
The statistical analysis conducted on geographies consisting of 117,051,528 people shows a poor positive correlation between the proportion of Seminole and unemployment rate among population between the ages 45 and 54 in the United States with a correlation coefficient (R) of 0.162 and weighted average of 4.8%. Similarly, the statistical analysis conducted on geographies consisting of 504,283,174 people shows a mild positive correlation between the proportion of Swedes and unemployment rate among population between the ages 45 and 54 in the United States with a correlation coefficient (R) of 0.307 and weighted average of 4.0%, a difference of 19.0%.
Unemployment Among Ages 45 to 54 years Correlation Summary
| Measurement | Seminole | Swedish |
| Minimum | 2.0% | 1.1% |
| Maximum | 27.3% | 50.0% |
| Range | 25.3% | 48.9% |
| Mean | 7.8% | 6.3% |
| Median | 5.7% | 4.1% |
| Interquartile 25% (IQ1) | 4.2% | 3.5% |
| Interquartile 75% (IQ3) | 8.0% | 5.0% |
| Interquartile Range (IQR) | 3.8% | 1.5% |
| Standard Deviation (Sample) | 6.3% | 8.7% |
| Standard Deviation (Population) | 6.2% | 8.6% |
Similar Demographics by Unemployment Among Ages 45 to 54 years
Demographics Similar to Seminole by Unemployment Among Ages 45 to 54 years
In terms of unemployment among ages 45 to 54 years, the demographic groups most similar to Seminole are Portuguese (4.8%, a difference of 0.060%), Immigrants from Albania (4.8%, a difference of 0.15%), Immigrants from Syria (4.8%, a difference of 0.16%), Delaware (4.8%, a difference of 0.17%), and Central American (4.8%, a difference of 0.17%).
| Demographics | Rating | Rank | Unemployment Among Ages 45 to 54 years |
| Alsatians | 1.6 /100 | #237 | Tragic 4.7% |
| Yaqui | 1.4 /100 | #238 | Tragic 4.7% |
| Spanish Americans | 1.4 /100 | #239 | Tragic 4.7% |
| Immigrants | Iraq | 1.3 /100 | #240 | Tragic 4.7% |
| Delaware | 1.3 /100 | #241 | Tragic 4.8% |
| Central Americans | 1.3 /100 | #242 | Tragic 4.8% |
| Portuguese | 1.1 /100 | #243 | Tragic 4.8% |
| Seminole | 1.1 /100 | #244 | Tragic 4.8% |
| Immigrants | Albania | 0.9 /100 | #245 | Tragic 4.8% |
| Immigrants | Syria | 0.9 /100 | #246 | Tragic 4.8% |
| Israelis | 0.9 /100 | #247 | Tragic 4.8% |
| Immigrants | Liberia | 0.8 /100 | #248 | Tragic 4.8% |
| Immigrants | Honduras | 0.7 /100 | #249 | Tragic 4.8% |
| Salvadorans | 0.7 /100 | #250 | Tragic 4.8% |
| Hondurans | 0.4 /100 | #251 | Tragic 4.8% |
Demographics Similar to Swedes by Unemployment Among Ages 45 to 54 years
In terms of unemployment among ages 45 to 54 years, the demographic groups most similar to Swedes are Scandinavian (4.0%, a difference of 0.010%), Venezuelan (4.0%, a difference of 0.15%), Cuban (4.0%, a difference of 0.15%), Immigrants from Bosnia and Herzegovina (4.0%, a difference of 0.20%), and Immigrants from Bolivia (4.0%, a difference of 0.63%).
| Demographics | Rating | Rank | Unemployment Among Ages 45 to 54 years |
| Danes | 100.0 /100 | #5 | Exceptional 3.9% |
| Immigrants | Cuba | 100.0 /100 | #6 | Exceptional 3.9% |
| Immigrants | Venezuela | 100.0 /100 | #7 | Exceptional 3.9% |
| Chinese | 100.0 /100 | #8 | Exceptional 4.0% |
| Czechs | 100.0 /100 | #9 | Exceptional 4.0% |
| Venezuelans | 100.0 /100 | #10 | Exceptional 4.0% |
| Scandinavians | 100.0 /100 | #11 | Exceptional 4.0% |
| Swedes | 100.0 /100 | #12 | Exceptional 4.0% |
| Cubans | 100.0 /100 | #13 | Exceptional 4.0% |
| Immigrants | Bosnia and Herzegovina | 100.0 /100 | #14 | Exceptional 4.0% |
| Immigrants | Bolivia | 100.0 /100 | #15 | Exceptional 4.0% |
| Thais | 100.0 /100 | #16 | Exceptional 4.0% |
| Tongans | 100.0 /100 | #17 | Exceptional 4.1% |
| Germans | 100.0 /100 | #18 | Exceptional 4.1% |
| Swiss | 100.0 /100 | #19 | Exceptional 4.1% |