Immigrants from Germany vs Mexican American Indian Median Female Earnings
COMPARE
Immigrants from Germany
Mexican American Indian
Median Female Earnings
Median Female Earnings Comparison
Immigrants from Germany
Mexican American Indians
$39,603
MEDIAN FEMALE EARNINGS
45.1/ 100
METRIC RATING
179th/ 347
METRIC RANK
$35,629
MEDIAN FEMALE EARNINGS
0.0/ 100
METRIC RATING
296th/ 347
METRIC RANK
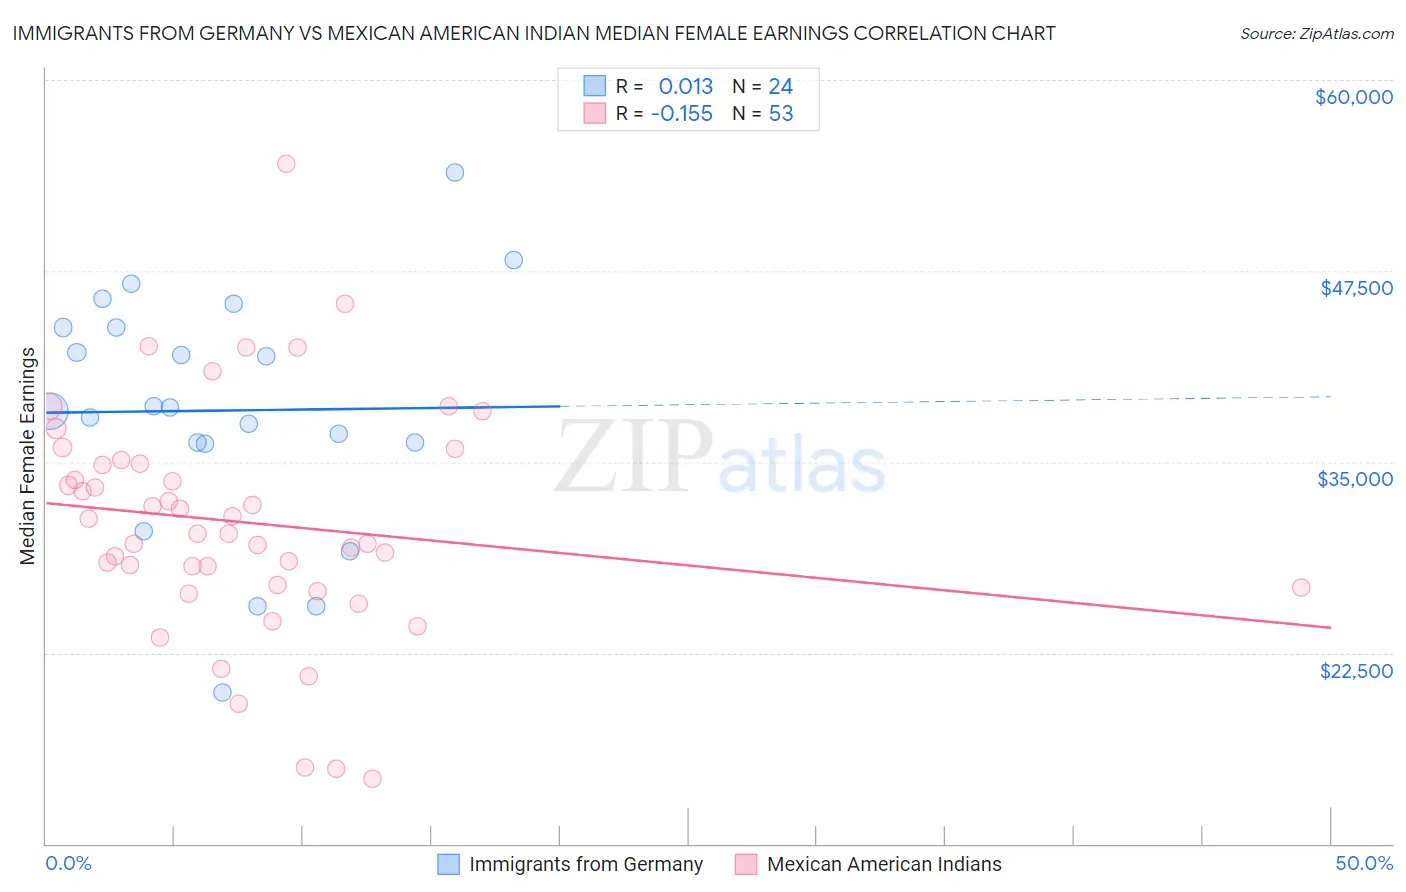
Immigrants from Germany vs Mexican American Indian Median Female Earnings Correlation Chart
The statistical analysis conducted on geographies consisting of 463,482,548 people shows no correlation between the proportion of Immigrants from Germany and median female earnings in the United States with a correlation coefficient (R) of 0.013 and weighted average of $39,603. Similarly, the statistical analysis conducted on geographies consisting of 317,476,651 people shows a poor negative correlation between the proportion of Mexican American Indians and median female earnings in the United States with a correlation coefficient (R) of -0.155 and weighted average of $35,629, a difference of 11.2%.
Median Female Earnings Correlation Summary
| Measurement | Immigrants from Germany | Mexican American Indian |
| Minimum | $19,917 | $14,250 |
| Maximum | $53,929 | $54,477 |
| Range | $34,012 | $40,227 |
| Mean | $38,361 | $31,030 |
| Median | $38,420 | $30,267 |
| Interquartile 25% (IQ1) | $36,204 | $26,842 |
| Interquartile 75% (IQ3) | $43,786 | $35,013 |
| Interquartile Range (IQR) | $7,582 | $8,171 |
| Standard Deviation (Sample) | $7,917 | $7,625 |
| Standard Deviation (Population) | $7,751 | $7,553 |
Similar Demographics by Median Female Earnings
Demographics Similar to Immigrants from Germany by Median Female Earnings
In terms of median female earnings, the demographic groups most similar to Immigrants from Germany are Slavic ($39,613, a difference of 0.030%), Costa Rican ($39,622, a difference of 0.050%), Immigrants from South America ($39,643, a difference of 0.10%), Nigerian ($39,641, a difference of 0.10%), and Immigrants from Kenya ($39,535, a difference of 0.17%).
| Demographics | Rating | Rank | Median Female Earnings |
| British | 53.8 /100 | #172 | Average $39,772 |
| Canadians | 51.4 /100 | #173 | Average $39,724 |
| South Americans | 50.0 /100 | #174 | Average $39,698 |
| Immigrants | South America | 47.2 /100 | #175 | Average $39,643 |
| Nigerians | 47.0 /100 | #176 | Average $39,641 |
| Costa Ricans | 46.1 /100 | #177 | Average $39,622 |
| Slavs | 45.6 /100 | #178 | Average $39,613 |
| Immigrants | Germany | 45.1 /100 | #179 | Average $39,603 |
| Immigrants | Kenya | 41.6 /100 | #180 | Average $39,535 |
| Tsimshian | 41.4 /100 | #181 | Average $39,530 |
| Tlingit-Haida | 40.5 /100 | #182 | Average $39,513 |
| Hungarians | 40.3 /100 | #183 | Average $39,510 |
| Europeans | 37.7 /100 | #184 | Fair $39,457 |
| Immigrants | West Indies | 36.9 /100 | #185 | Fair $39,441 |
| Colombians | 36.9 /100 | #186 | Fair $39,439 |
Demographics Similar to Mexican American Indians by Median Female Earnings
In terms of median female earnings, the demographic groups most similar to Mexican American Indians are Comanche ($35,661, a difference of 0.090%), Cheyenne ($35,673, a difference of 0.12%), Guatemalan ($35,695, a difference of 0.19%), Hmong ($35,498, a difference of 0.37%), and American ($35,777, a difference of 0.42%).
| Demographics | Rating | Rank | Median Female Earnings |
| Bangladeshis | 0.0 /100 | #289 | Tragic $35,960 |
| Central American Indians | 0.0 /100 | #290 | Tragic $35,930 |
| Blackfeet | 0.0 /100 | #291 | Tragic $35,864 |
| Americans | 0.0 /100 | #292 | Tragic $35,777 |
| Guatemalans | 0.0 /100 | #293 | Tragic $35,695 |
| Cheyenne | 0.0 /100 | #294 | Tragic $35,673 |
| Comanche | 0.0 /100 | #295 | Tragic $35,661 |
| Mexican American Indians | 0.0 /100 | #296 | Tragic $35,629 |
| Hmong | 0.0 /100 | #297 | Tragic $35,498 |
| Immigrants | Micronesia | 0.0 /100 | #298 | Tragic $35,477 |
| Immigrants | Guatemala | 0.0 /100 | #299 | Tragic $35,444 |
| Yuman | 0.0 /100 | #300 | Tragic $35,377 |
| Pima | 0.0 /100 | #301 | Tragic $35,326 |
| Blacks/African Americans | 0.0 /100 | #302 | Tragic $35,315 |
| Immigrants | Latin America | 0.0 /100 | #303 | Tragic $35,307 |