Puerto Rican vs Egyptian Householder Income Under 25 years
COMPARE
Puerto Rican
Egyptian
Householder Income Under 25 years
Householder Income Under 25 years Comparison
Puerto Ricans
Egyptians
$39,726
HOUSEHOLDER INCOME UNDER 25 YEARS
0.0/ 100
METRIC RATING
346th/ 347
METRIC RANK
$54,444
HOUSEHOLDER INCOME UNDER 25 YEARS
99.6/ 100
METRIC RATING
80th/ 347
METRIC RANK
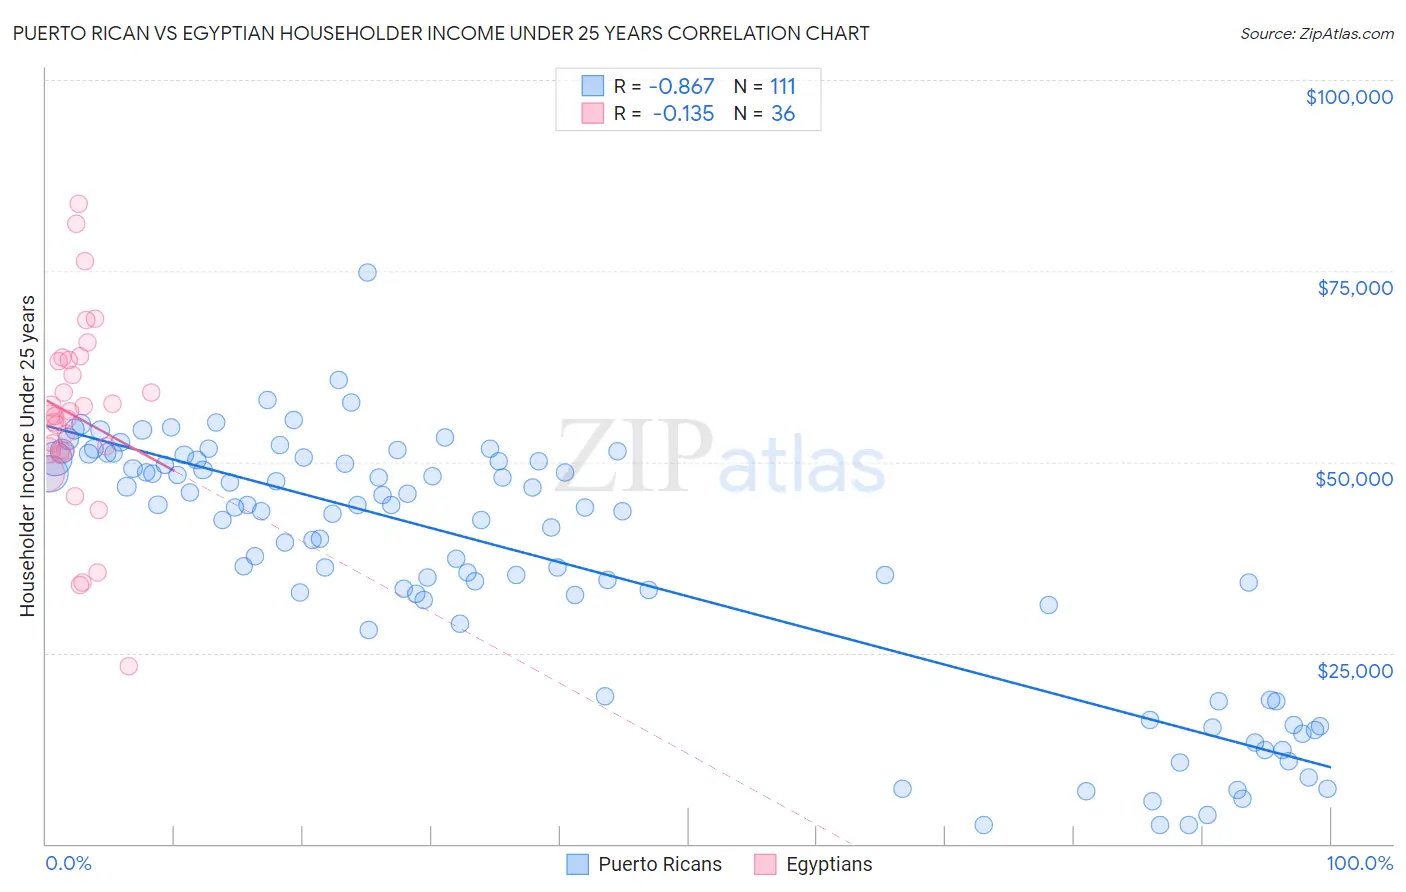
Puerto Rican vs Egyptian Householder Income Under 25 years Correlation Chart
The statistical analysis conducted on geographies consisting of 421,445,593 people shows a very strong negative correlation between the proportion of Puerto Ricans and household income with householder under the age of 25 in the United States with a correlation coefficient (R) of -0.867 and weighted average of $39,726. Similarly, the statistical analysis conducted on geographies consisting of 240,038,174 people shows a poor negative correlation between the proportion of Egyptians and household income with householder under the age of 25 in the United States with a correlation coefficient (R) of -0.135 and weighted average of $54,444, a difference of 37.0%.
Householder Income Under 25 years Correlation Summary
| Measurement | Puerto Rican | Egyptian |
| Minimum | $2,499 | $23,214 |
| Maximum | $74,844 | $83,750 |
| Range | $72,345 | $60,536 |
| Mean | $37,468 | $55,910 |
| Median | $43,546 | $56,055 |
| Interquartile 25% (IQ1) | $28,872 | $51,447 |
| Interquartile 75% (IQ3) | $50,281 | $63,229 |
| Interquartile Range (IQR) | $21,410 | $11,783 |
| Standard Deviation (Sample) | $16,633 | $12,425 |
| Standard Deviation (Population) | $16,558 | $12,251 |
Similar Demographics by Householder Income Under 25 years
Demographics Similar to Puerto Ricans by Householder Income Under 25 years
In terms of householder income under 25 years, the demographic groups most similar to Puerto Ricans are Navajo ($42,380, a difference of 6.7%), Immigrants from Congo ($43,266, a difference of 8.9%), Immigrants from Yemen ($43,591, a difference of 9.7%), Arapaho ($44,003, a difference of 10.8%), and Houma ($44,356, a difference of 11.7%).
| Demographics | Rating | Rank | Householder Income Under 25 years |
| Creek | 0.0 /100 | #333 | Tragic $45,371 |
| Cajuns | 0.0 /100 | #334 | Tragic $45,338 |
| Cheyenne | 0.0 /100 | #335 | Tragic $45,275 |
| Tohono O'odham | 0.0 /100 | #336 | Tragic $45,248 |
| Pueblo | 0.0 /100 | #337 | Tragic $45,018 |
| Chickasaw | 0.0 /100 | #338 | Tragic $44,763 |
| Kiowa | 0.0 /100 | #339 | Tragic $44,733 |
| Blacks/African Americans | 0.0 /100 | #340 | Tragic $44,381 |
| Houma | 0.0 /100 | #341 | Tragic $44,356 |
| Arapaho | 0.0 /100 | #342 | Tragic $44,003 |
| Immigrants | Yemen | 0.0 /100 | #343 | Tragic $43,591 |
| Immigrants | Congo | 0.0 /100 | #344 | Tragic $43,266 |
| Navajo | 0.0 /100 | #345 | Tragic $42,380 |
| Puerto Ricans | 0.0 /100 | #346 | Tragic $39,726 |
| Lumbee | 0.0 /100 | #347 | Tragic $34,584 |
Demographics Similar to Egyptians by Householder Income Under 25 years
In terms of householder income under 25 years, the demographic groups most similar to Egyptians are Immigrants from Italy ($54,449, a difference of 0.010%), Portuguese ($54,436, a difference of 0.010%), Nepalese ($54,472, a difference of 0.050%), Immigrants from Southern Europe ($54,484, a difference of 0.070%), and Immigrants from Brazil ($54,487, a difference of 0.080%).
| Demographics | Rating | Rank | Householder Income Under 25 years |
| Macedonians | 99.7 /100 | #73 | Exceptional $54,563 |
| Immigrants | Grenada | 99.7 /100 | #74 | Exceptional $54,538 |
| Immigrants | Sri Lanka | 99.7 /100 | #75 | Exceptional $54,512 |
| Immigrants | Brazil | 99.6 /100 | #76 | Exceptional $54,487 |
| Immigrants | Southern Europe | 99.6 /100 | #77 | Exceptional $54,484 |
| Nepalese | 99.6 /100 | #78 | Exceptional $54,472 |
| Immigrants | Italy | 99.6 /100 | #79 | Exceptional $54,449 |
| Egyptians | 99.6 /100 | #80 | Exceptional $54,444 |
| Portuguese | 99.6 /100 | #81 | Exceptional $54,436 |
| Russians | 99.5 /100 | #82 | Exceptional $54,389 |
| Laotians | 99.5 /100 | #83 | Exceptional $54,369 |
| Bulgarians | 99.5 /100 | #84 | Exceptional $54,352 |
| Immigrants | Czechoslovakia | 99.5 /100 | #85 | Exceptional $54,352 |
| Immigrants | Croatia | 99.5 /100 | #86 | Exceptional $54,343 |
| Brazilians | 99.5 /100 | #87 | Exceptional $54,335 |