Paraguayan vs Immigrants from Hungary Householder Income Over 65 years
COMPARE
Paraguayan
Immigrants from Hungary
Householder Income Over 65 years
Householder Income Over 65 years Comparison
Paraguayans
Immigrants from Hungary
$64,443
HOUSEHOLDER INCOME OVER 65 YEARS
97.4/ 100
METRIC RATING
89th/ 347
METRIC RANK
$64,277
HOUSEHOLDER INCOME OVER 65 YEARS
97.0/ 100
METRIC RATING
96th/ 347
METRIC RANK
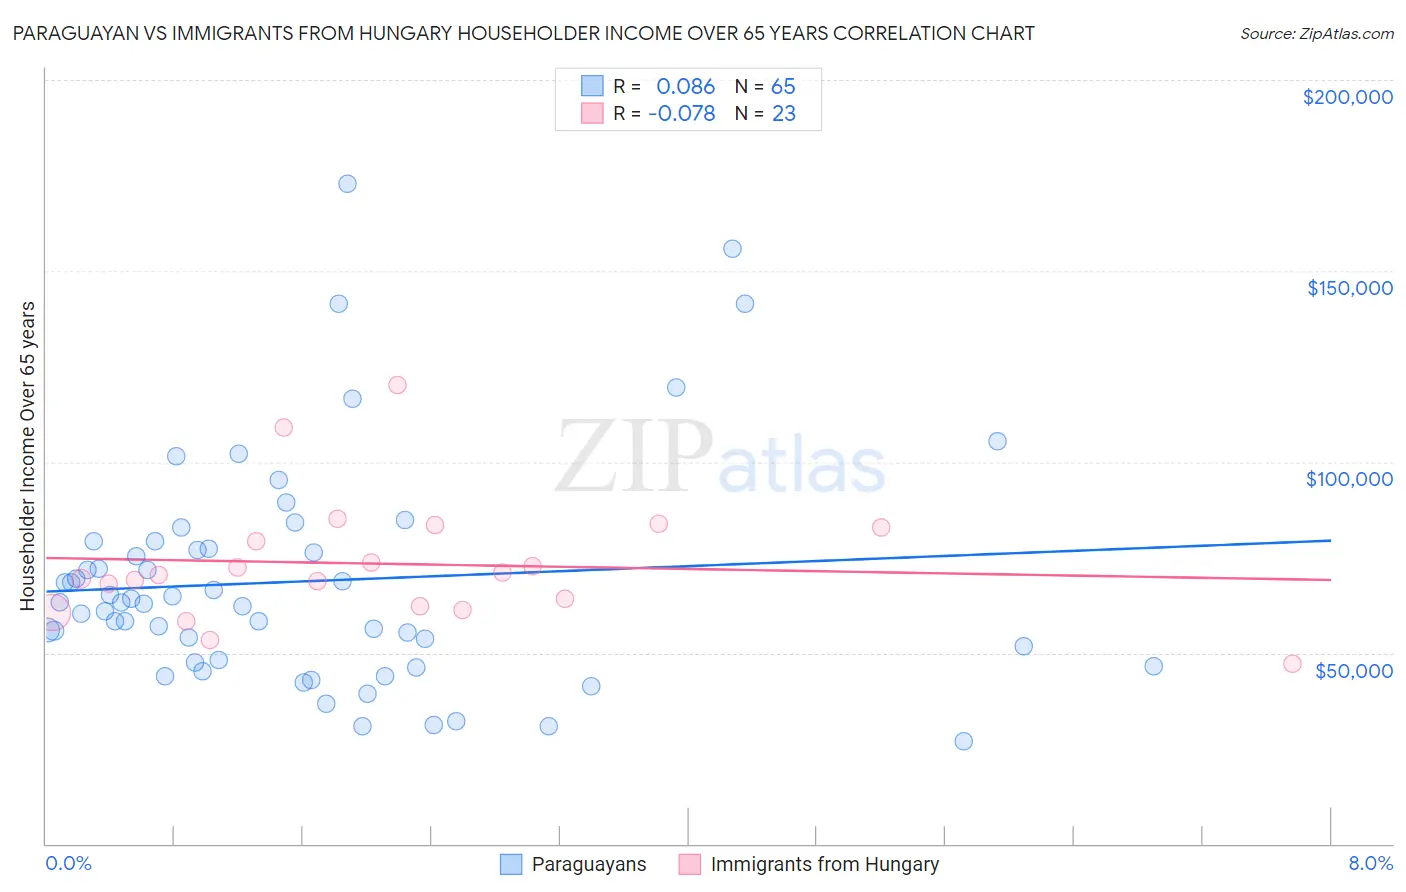
Paraguayan vs Immigrants from Hungary Householder Income Over 65 years Correlation Chart
The statistical analysis conducted on geographies consisting of 95,003,306 people shows a slight positive correlation between the proportion of Paraguayans and household income with householder over the age of 65 in the United States with a correlation coefficient (R) of 0.086 and weighted average of $64,443. Similarly, the statistical analysis conducted on geographies consisting of 195,502,299 people shows a slight negative correlation between the proportion of Immigrants from Hungary and household income with householder over the age of 65 in the United States with a correlation coefficient (R) of -0.078 and weighted average of $64,277, a difference of 0.26%.
Householder Income Over 65 years Correlation Summary
| Measurement | Paraguayan | Immigrants from Hungary |
| Minimum | $26,765 | $47,165 |
| Maximum | $172,969 | $120,169 |
| Range | $146,204 | $73,004 |
| Mean | $68,770 | $73,307 |
| Median | $63,287 | $70,218 |
| Interquartile 25% (IQ1) | $47,789 | $62,092 |
| Interquartile 75% (IQ3) | $78,220 | $82,782 |
| Interquartile Range (IQR) | $30,430 | $20,690 |
| Standard Deviation (Sample) | $29,858 | $16,316 |
| Standard Deviation (Population) | $29,627 | $15,958 |
Demographics Similar to Paraguayans and Immigrants from Hungary by Householder Income Over 65 years
In terms of householder income over 65 years, the demographic groups most similar to Paraguayans are Immigrants from Kuwait ($64,433, a difference of 0.020%), Immigrants from Romania ($64,462, a difference of 0.030%), Austrian ($64,470, a difference of 0.040%), Immigrants from Oceania ($64,416, a difference of 0.040%), and Immigrants from Bulgaria ($64,379, a difference of 0.10%). Similarly, the demographic groups most similar to Immigrants from Hungary are Immigrants from Egypt ($64,299, a difference of 0.030%), Immigrants from Latvia ($64,298, a difference of 0.030%), Jordanian ($64,313, a difference of 0.060%), Sri Lankan ($64,201, a difference of 0.12%), and Immigrants from Bulgaria ($64,379, a difference of 0.16%).
| Demographics | Rating | Rank | Householder Income Over 65 years |
| Immigrants | Fiji | 98.2 /100 | #82 | Exceptional $64,795 |
| Northern Europeans | 97.9 /100 | #83 | Exceptional $64,658 |
| Immigrants | Greece | 97.9 /100 | #84 | Exceptional $64,636 |
| Immigrants | Lebanon | 97.6 /100 | #85 | Exceptional $64,521 |
| Immigrants | Russia | 97.6 /100 | #86 | Exceptional $64,512 |
| Austrians | 97.5 /100 | #87 | Exceptional $64,470 |
| Immigrants | Romania | 97.5 /100 | #88 | Exceptional $64,462 |
| Paraguayans | 97.4 /100 | #89 | Exceptional $64,443 |
| Immigrants | Kuwait | 97.4 /100 | #90 | Exceptional $64,433 |
| Immigrants | Oceania | 97.4 /100 | #91 | Exceptional $64,416 |
| Immigrants | Bulgaria | 97.3 /100 | #92 | Exceptional $64,379 |
| Jordanians | 97.1 /100 | #93 | Exceptional $64,313 |
| Immigrants | Egypt | 97.0 /100 | #94 | Exceptional $64,299 |
| Immigrants | Latvia | 97.0 /100 | #95 | Exceptional $64,298 |
| Immigrants | Hungary | 97.0 /100 | #96 | Exceptional $64,277 |
| Sri Lankans | 96.7 /100 | #97 | Exceptional $64,201 |
| Romanians | 96.5 /100 | #98 | Exceptional $64,142 |
| Assyrians/Chaldeans/Syriacs | 96.4 /100 | #99 | Exceptional $64,108 |
| Immigrants | South Eastern Asia | 96.3 /100 | #100 | Exceptional $64,089 |
| Immigrants | Italy | 96.2 /100 | #101 | Exceptional $64,065 |
| Chileans | 95.8 /100 | #102 | Exceptional $63,957 |