Osage vs Scottish Median Male Earnings
COMPARE
Osage
Scottish
Median Male Earnings
Median Male Earnings Comparison
Osage
Scottish
$50,292
MEDIAN MALE EARNINGS
1.6/ 100
METRIC RATING
250th/ 347
METRIC RANK
$55,793
MEDIAN MALE EARNINGS
78.2/ 100
METRIC RATING
148th/ 347
METRIC RANK
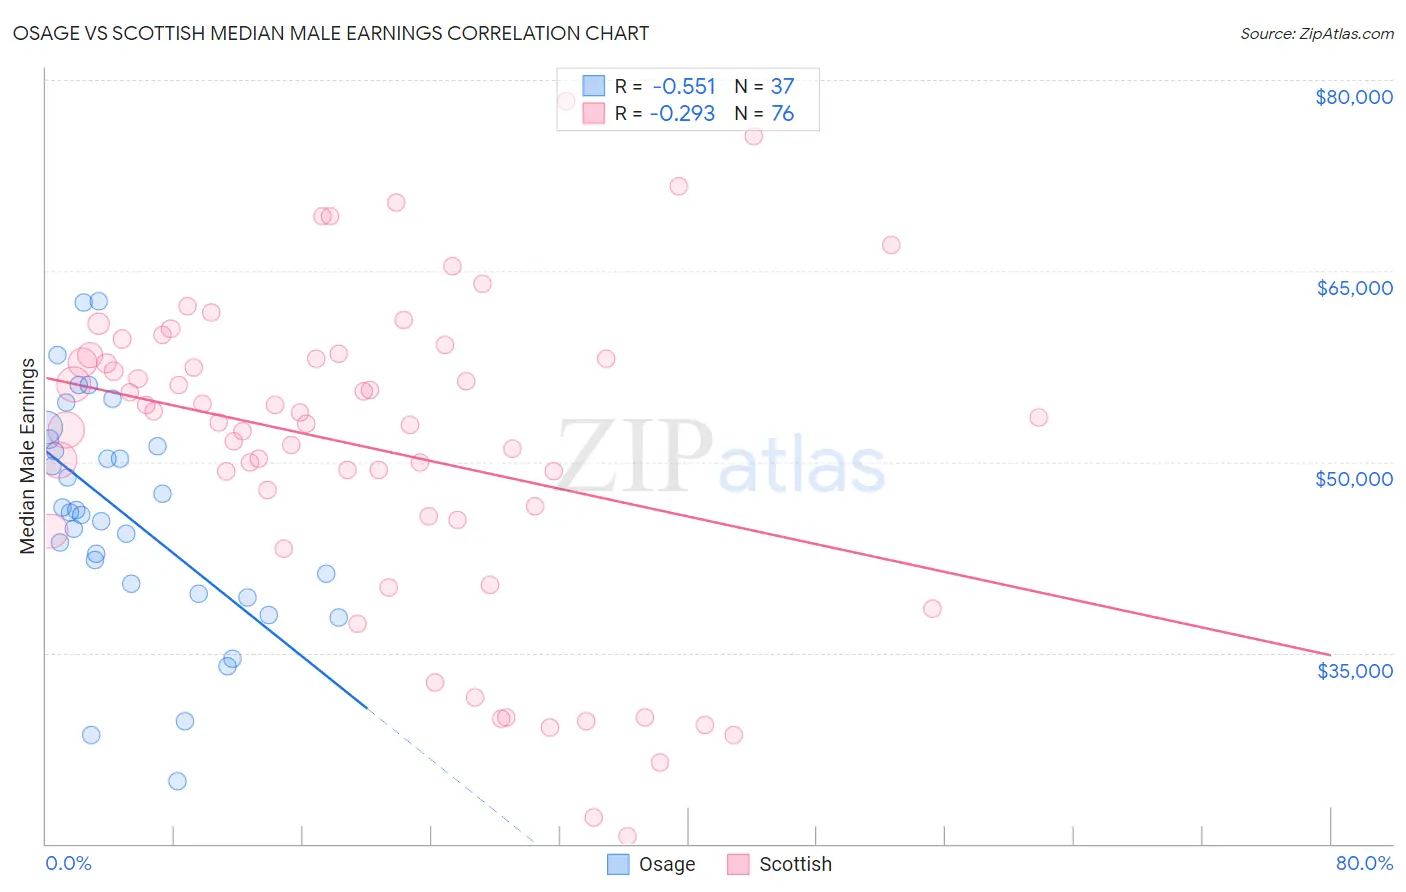
Osage vs Scottish Median Male Earnings Correlation Chart
The statistical analysis conducted on geographies consisting of 91,793,042 people shows a substantial negative correlation between the proportion of Osage and median male earnings in the United States with a correlation coefficient (R) of -0.551 and weighted average of $50,292. Similarly, the statistical analysis conducted on geographies consisting of 565,821,197 people shows a weak negative correlation between the proportion of Scottish and median male earnings in the United States with a correlation coefficient (R) of -0.293 and weighted average of $55,793, a difference of 10.9%.
Median Male Earnings Correlation Summary
| Measurement | Osage | Scottish |
| Minimum | $24,954 | $20,625 |
| Maximum | $62,626 | $78,335 |
| Range | $37,672 | $57,710 |
| Mean | $45,789 | $51,052 |
| Median | $46,052 | $53,253 |
| Interquartile 25% (IQ1) | $40,033 | $45,587 |
| Interquartile 75% (IQ3) | $51,519 | $58,253 |
| Interquartile Range (IQR) | $11,486 | $12,667 |
| Standard Deviation (Sample) | $8,890 | $12,626 |
| Standard Deviation (Population) | $8,769 | $12,543 |
Similar Demographics by Median Male Earnings
Demographics Similar to Osage by Median Male Earnings
In terms of median male earnings, the demographic groups most similar to Osage are Immigrants from Burma/Myanmar ($50,298, a difference of 0.010%), Immigrants from Grenada ($50,279, a difference of 0.020%), Immigrants from Guyana ($50,321, a difference of 0.060%), Subsaharan African ($50,408, a difference of 0.23%), and Immigrants from Ecuador ($50,474, a difference of 0.36%).
| Demographics | Rating | Rank | Median Male Earnings |
| French American Indians | 2.2 /100 | #243 | Tragic $50,611 |
| Houma | 2.0 /100 | #244 | Tragic $50,547 |
| Hawaiians | 1.9 /100 | #245 | Tragic $50,488 |
| Immigrants | Ecuador | 1.9 /100 | #246 | Tragic $50,474 |
| Sub-Saharan Africans | 1.8 /100 | #247 | Tragic $50,408 |
| Immigrants | Guyana | 1.6 /100 | #248 | Tragic $50,321 |
| Immigrants | Burma/Myanmar | 1.6 /100 | #249 | Tragic $50,298 |
| Osage | 1.6 /100 | #250 | Tragic $50,292 |
| Immigrants | Grenada | 1.6 /100 | #251 | Tragic $50,279 |
| Immigrants | Cabo Verde | 1.2 /100 | #252 | Tragic $50,009 |
| German Russians | 1.1 /100 | #253 | Tragic $49,924 |
| Senegalese | 1.0 /100 | #254 | Tragic $49,774 |
| Alaskan Athabascans | 0.9 /100 | #255 | Tragic $49,748 |
| Alaska Natives | 0.9 /100 | #256 | Tragic $49,711 |
| British West Indians | 0.8 /100 | #257 | Tragic $49,636 |
Demographics Similar to Scottish by Median Male Earnings
In terms of median male earnings, the demographic groups most similar to Scottish are Immigrants from Philippines ($55,809, a difference of 0.030%), English ($55,747, a difference of 0.080%), Swiss ($55,731, a difference of 0.11%), Immigrants from Oceania ($55,712, a difference of 0.15%), and Peruvian ($55,659, a difference of 0.24%).
| Demographics | Rating | Rank | Median Male Earnings |
| Danes | 84.8 /100 | #141 | Excellent $56,246 |
| Ethiopians | 84.8 /100 | #142 | Excellent $56,243 |
| Sri Lankans | 83.4 /100 | #143 | Excellent $56,136 |
| Immigrants | Uganda | 82.4 /100 | #144 | Excellent $56,064 |
| Norwegians | 80.9 /100 | #145 | Excellent $55,965 |
| Immigrants | Chile | 80.7 /100 | #146 | Excellent $55,954 |
| Immigrants | Philippines | 78.4 /100 | #147 | Good $55,809 |
| Scottish | 78.2 /100 | #148 | Good $55,793 |
| English | 77.4 /100 | #149 | Good $55,747 |
| Swiss | 77.1 /100 | #150 | Good $55,731 |
| Immigrants | Oceania | 76.8 /100 | #151 | Good $55,712 |
| Peruvians | 75.8 /100 | #152 | Good $55,659 |
| Immigrants | Nepal | 75.0 /100 | #153 | Good $55,615 |
| Taiwanese | 73.9 /100 | #154 | Good $55,556 |
| Scandinavians | 73.4 /100 | #155 | Good $55,527 |