Okinawan vs Immigrants from Sweden Median Family Income
COMPARE
Okinawan
Immigrants from Sweden
Median Family Income
Median Family Income Comparison
Okinawans
Immigrants from Sweden
$129,979
MEDIAN FAMILY INCOME
100.0/ 100
METRIC RATING
9th/ 347
METRIC RANK
$122,765
MEDIAN FAMILY INCOME
100.0/ 100
METRIC RATING
22nd/ 347
METRIC RANK
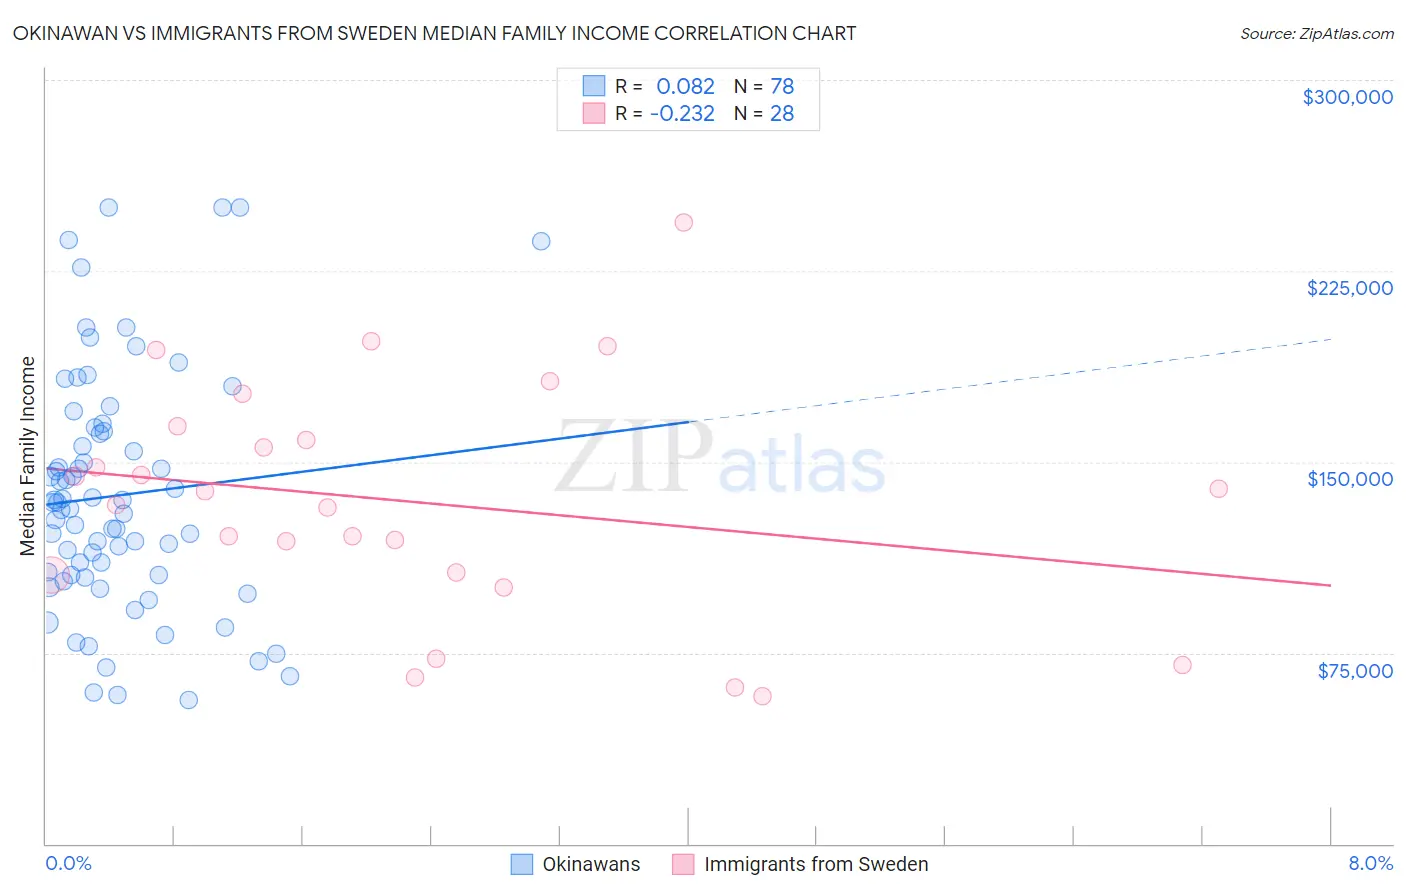
Okinawan vs Immigrants from Sweden Median Family Income Correlation Chart
The statistical analysis conducted on geographies consisting of 73,711,216 people shows a slight positive correlation between the proportion of Okinawans and median family income in the United States with a correlation coefficient (R) of 0.082 and weighted average of $129,979. Similarly, the statistical analysis conducted on geographies consisting of 164,691,599 people shows a weak negative correlation between the proportion of Immigrants from Sweden and median family income in the United States with a correlation coefficient (R) of -0.232 and weighted average of $122,765, a difference of 5.9%.
Median Family Income Correlation Summary
| Measurement | Okinawan | Immigrants from Sweden |
| Minimum | $56,429 | $57,930 |
| Maximum | $250,001 | $244,028 |
| Range | $193,572 | $186,098 |
| Mean | $136,798 | $134,549 |
| Median | $132,761 | $135,850 |
| Interquartile 25% (IQ1) | $105,402 | $105,866 |
| Interquartile 75% (IQ3) | $161,875 | $161,266 |
| Interquartile Range (IQR) | $56,473 | $55,400 |
| Standard Deviation (Sample) | $46,889 | $46,012 |
| Standard Deviation (Population) | $46,587 | $45,183 |
Demographics Similar to Okinawans and Immigrants from Sweden by Median Family Income
In terms of median family income, the demographic groups most similar to Okinawans are Immigrants from Iran ($130,894, a difference of 0.70%), Immigrants from Hong Kong ($131,067, a difference of 0.84%), Thai ($131,281, a difference of 1.0%), Immigrants from Ireland ($127,584, a difference of 1.9%), and Immigrants from Israel ($127,430, a difference of 2.0%). Similarly, the demographic groups most similar to Immigrants from Sweden are Immigrants from Japan ($122,764, a difference of 0.0%), Immigrants from Korea ($122,800, a difference of 0.030%), Burmese ($123,369, a difference of 0.49%), Immigrants from Northern Europe ($121,840, a difference of 0.76%), and Immigrants from Belgium ($123,831, a difference of 0.87%).
| Demographics | Rating | Rank | Median Family Income |
| Iranians | 100.0 /100 | #5 | Exceptional $133,839 |
| Thais | 100.0 /100 | #6 | Exceptional $131,281 |
| Immigrants | Hong Kong | 100.0 /100 | #7 | Exceptional $131,067 |
| Immigrants | Iran | 100.0 /100 | #8 | Exceptional $130,894 |
| Okinawans | 100.0 /100 | #9 | Exceptional $129,979 |
| Immigrants | Ireland | 100.0 /100 | #10 | Exceptional $127,584 |
| Immigrants | Israel | 100.0 /100 | #11 | Exceptional $127,430 |
| Cypriots | 100.0 /100 | #12 | Exceptional $127,064 |
| Immigrants | Australia | 100.0 /100 | #13 | Exceptional $126,620 |
| Immigrants | South Central Asia | 100.0 /100 | #14 | Exceptional $125,956 |
| Eastern Europeans | 100.0 /100 | #15 | Exceptional $125,546 |
| Immigrants | China | 100.0 /100 | #16 | Exceptional $125,540 |
| Indians (Asian) | 100.0 /100 | #17 | Exceptional $125,312 |
| Immigrants | Eastern Asia | 100.0 /100 | #18 | Exceptional $125,150 |
| Immigrants | Belgium | 100.0 /100 | #19 | Exceptional $123,831 |
| Burmese | 100.0 /100 | #20 | Exceptional $123,369 |
| Immigrants | Korea | 100.0 /100 | #21 | Exceptional $122,800 |
| Immigrants | Sweden | 100.0 /100 | #22 | Exceptional $122,765 |
| Immigrants | Japan | 100.0 /100 | #23 | Exceptional $122,764 |
| Immigrants | Northern Europe | 100.0 /100 | #24 | Exceptional $121,840 |
| Turks | 100.0 /100 | #25 | Exceptional $121,202 |