Norwegian vs British West Indian Householder Income Ages 45 - 64 years
COMPARE
Norwegian
British West Indian
Householder Income Ages 45 - 64 years
Householder Income Ages 45 - 64 years Comparison
Norwegians
British West Indians
$103,682
HOUSEHOLDER INCOME AGES 45 - 64 YEARS
84.3/ 100
METRIC RATING
140th/ 347
METRIC RANK
$85,571
HOUSEHOLDER INCOME AGES 45 - 64 YEARS
0.1/ 100
METRIC RATING
294th/ 347
METRIC RANK
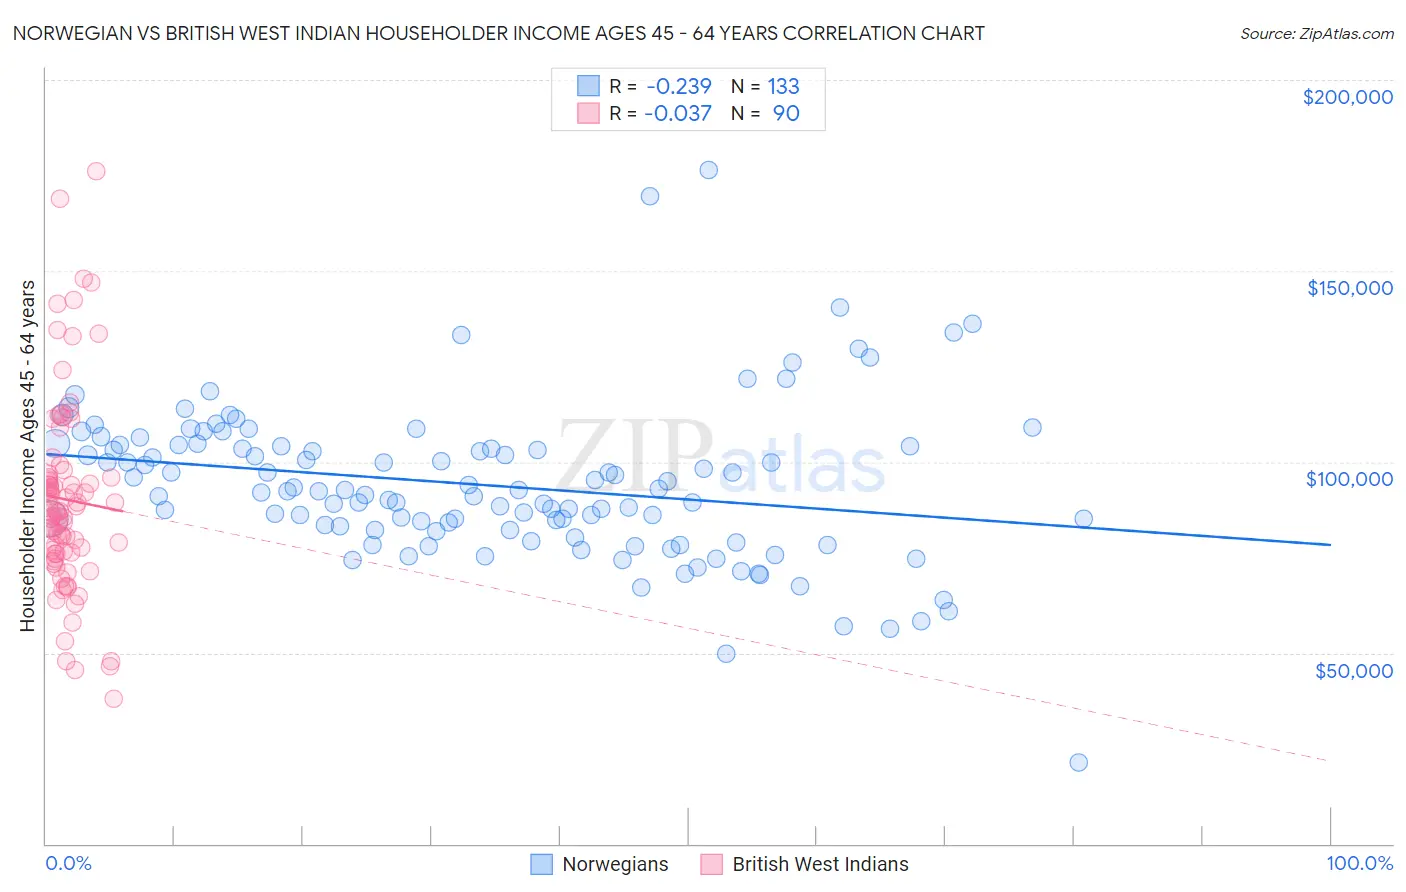
Norwegian vs British West Indian Householder Income Ages 45 - 64 years Correlation Chart
The statistical analysis conducted on geographies consisting of 530,964,543 people shows a weak negative correlation between the proportion of Norwegians and household income with householder between the ages 45 and 64 in the United States with a correlation coefficient (R) of -0.239 and weighted average of $103,682. Similarly, the statistical analysis conducted on geographies consisting of 152,542,369 people shows no correlation between the proportion of British West Indians and household income with householder between the ages 45 and 64 in the United States with a correlation coefficient (R) of -0.037 and weighted average of $85,571, a difference of 21.2%.
Householder Income Ages 45 - 64 years Correlation Summary
| Measurement | Norwegian | British West Indian |
| Minimum | $21,250 | $37,917 |
| Maximum | $176,301 | $176,146 |
| Range | $155,051 | $138,229 |
| Mean | $93,934 | $90,120 |
| Median | $92,185 | $86,807 |
| Interquartile 25% (IQ1) | $82,157 | $76,092 |
| Interquartile 75% (IQ3) | $104,273 | $95,919 |
| Interquartile Range (IQR) | $22,116 | $19,827 |
| Standard Deviation (Sample) | $20,569 | $25,567 |
| Standard Deviation (Population) | $20,492 | $25,425 |
Similar Demographics by Householder Income Ages 45 - 64 years
Demographics Similar to Norwegians by Householder Income Ages 45 - 64 years
In terms of householder income ages 45 - 64 years, the demographic groups most similar to Norwegians are Immigrants from Oceania ($103,705, a difference of 0.020%), Ethiopian ($103,736, a difference of 0.050%), Immigrants from Uganda ($103,584, a difference of 0.090%), Luxembourger ($103,536, a difference of 0.14%), and Serbian ($103,522, a difference of 0.15%).
| Demographics | Rating | Rank | Householder Income Ages 45 - 64 years |
| Arabs | 89.3 /100 | #133 | Excellent $104,566 |
| Canadians | 89.3 /100 | #134 | Excellent $104,560 |
| Brazilians | 88.6 /100 | #135 | Excellent $104,408 |
| Taiwanese | 87.4 /100 | #136 | Excellent $104,180 |
| Hungarians | 85.8 /100 | #137 | Excellent $103,913 |
| Ethiopians | 84.7 /100 | #138 | Excellent $103,736 |
| Immigrants | Oceania | 84.5 /100 | #139 | Excellent $103,705 |
| Norwegians | 84.3 /100 | #140 | Excellent $103,682 |
| Immigrants | Uganda | 83.7 /100 | #141 | Excellent $103,584 |
| Luxembourgers | 83.3 /100 | #142 | Excellent $103,536 |
| Serbians | 83.2 /100 | #143 | Excellent $103,522 |
| Czechs | 83.1 /100 | #144 | Excellent $103,507 |
| Ugandans | 82.9 /100 | #145 | Excellent $103,472 |
| Immigrants | Chile | 82.5 /100 | #146 | Excellent $103,412 |
| Basques | 82.3 /100 | #147 | Excellent $103,387 |
Demographics Similar to British West Indians by Householder Income Ages 45 - 64 years
In terms of householder income ages 45 - 64 years, the demographic groups most similar to British West Indians are Immigrants from Grenada ($85,552, a difference of 0.020%), Comanche ($85,787, a difference of 0.25%), Immigrants from Zaire ($85,207, a difference of 0.43%), Fijian ($85,187, a difference of 0.45%), and Immigrants from Central America ($85,965, a difference of 0.46%).
| Demographics | Rating | Rank | Householder Income Ages 45 - 64 years |
| Bangladeshis | 0.1 /100 | #287 | Tragic $86,402 |
| Immigrants | St. Vincent and the Grenadines | 0.1 /100 | #288 | Tragic $86,394 |
| Cubans | 0.1 /100 | #289 | Tragic $86,301 |
| Cherokee | 0.1 /100 | #290 | Tragic $86,125 |
| Hispanics or Latinos | 0.1 /100 | #291 | Tragic $86,006 |
| Immigrants | Central America | 0.1 /100 | #292 | Tragic $85,965 |
| Comanche | 0.1 /100 | #293 | Tragic $85,787 |
| British West Indians | 0.1 /100 | #294 | Tragic $85,571 |
| Immigrants | Grenada | 0.1 /100 | #295 | Tragic $85,552 |
| Immigrants | Zaire | 0.1 /100 | #296 | Tragic $85,207 |
| Fijians | 0.1 /100 | #297 | Tragic $85,187 |
| Africans | 0.0 /100 | #298 | Tragic $84,925 |
| Immigrants | Mexico | 0.0 /100 | #299 | Tragic $84,910 |
| Indonesians | 0.0 /100 | #300 | Tragic $84,890 |
| Potawatomi | 0.0 /100 | #301 | Tragic $84,613 |