Nigerian vs Nepalese Unemployment Among Ages 16 to 19 years
COMPARE
Nigerian
Nepalese
Unemployment Among Ages 16 to 19 years
Unemployment Among Ages 16 to 19 years Comparison
Nigerians
Nepalese
18.9%
UNEMPLOYMENT AMONG AGES 16 TO 19 YEARS
0.2/ 100
METRIC RATING
260th/ 347
METRIC RANK
18.2%
UNEMPLOYMENT AMONG AGES 16 TO 19 YEARS
4.2/ 100
METRIC RATING
231st/ 347
METRIC RANK
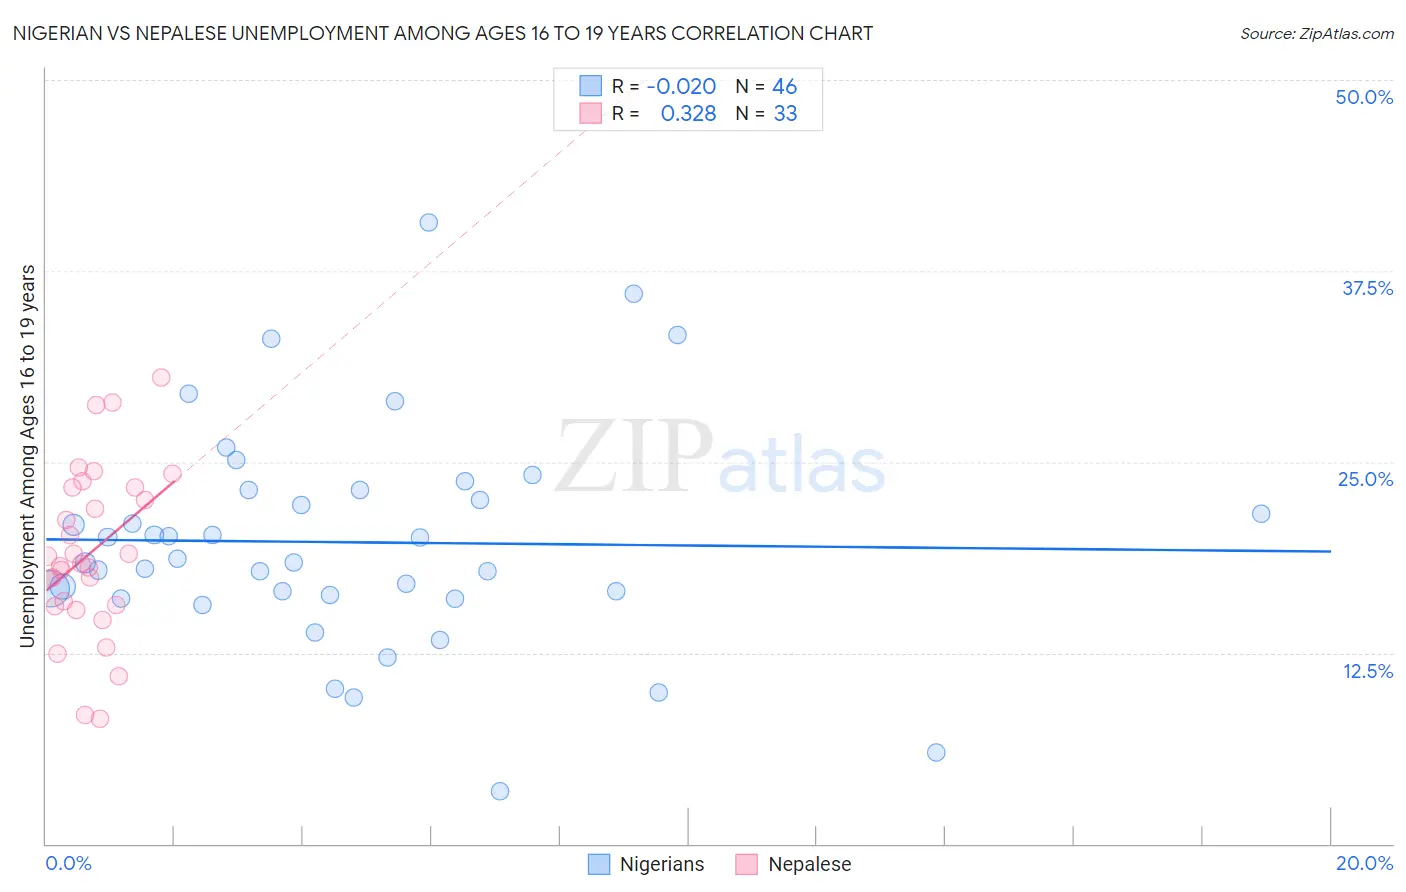
Nigerian vs Nepalese Unemployment Among Ages 16 to 19 years Correlation Chart
The statistical analysis conducted on geographies consisting of 322,180,468 people shows no correlation between the proportion of Nigerians and unemployment rate among population between the ages 16 and 19 in the United States with a correlation coefficient (R) of -0.020 and weighted average of 18.9%. Similarly, the statistical analysis conducted on geographies consisting of 24,305,512 people shows a mild positive correlation between the proportion of Nepalese and unemployment rate among population between the ages 16 and 19 in the United States with a correlation coefficient (R) of 0.328 and weighted average of 18.2%, a difference of 3.8%.
Unemployment Among Ages 16 to 19 years Correlation Summary
| Measurement | Nigerian | Nepalese |
| Minimum | 3.4% | 8.2% |
| Maximum | 40.6% | 30.5% |
| Range | 37.2% | 22.3% |
| Mean | 19.7% | 19.1% |
| Median | 18.5% | 18.3% |
| Interquartile 25% (IQ1) | 16.3% | 15.6% |
| Interquartile 75% (IQ3) | 23.1% | 23.3% |
| Interquartile Range (IQR) | 6.8% | 7.7% |
| Standard Deviation (Sample) | 7.3% | 5.4% |
| Standard Deviation (Population) | 7.2% | 5.4% |
Similar Demographics by Unemployment Among Ages 16 to 19 years
Demographics Similar to Nigerians by Unemployment Among Ages 16 to 19 years
In terms of unemployment among ages 16 to 19 years, the demographic groups most similar to Nigerians are Spanish American Indian (18.9%, a difference of 0.040%), Immigrants from Central America (18.9%, a difference of 0.080%), Salvadoran (18.9%, a difference of 0.080%), Immigrants from Mexico (18.9%, a difference of 0.16%), and Cree (19.0%, a difference of 0.22%).
| Demographics | Rating | Rank | Unemployment Among Ages 16 to 19 years |
| Central Americans | 0.3 /100 | #253 | Tragic 18.8% |
| Apache | 0.3 /100 | #254 | Tragic 18.8% |
| Immigrants | Cameroon | 0.3 /100 | #255 | Tragic 18.8% |
| Mexican American Indians | 0.3 /100 | #256 | Tragic 18.8% |
| Immigrants | Nigeria | 0.2 /100 | #257 | Tragic 18.9% |
| Immigrants | Mexico | 0.2 /100 | #258 | Tragic 18.9% |
| Immigrants | Central America | 0.2 /100 | #259 | Tragic 18.9% |
| Nigerians | 0.2 /100 | #260 | Tragic 18.9% |
| Spanish American Indians | 0.1 /100 | #261 | Tragic 18.9% |
| Salvadorans | 0.1 /100 | #262 | Tragic 18.9% |
| Cree | 0.1 /100 | #263 | Tragic 19.0% |
| Yaqui | 0.1 /100 | #264 | Tragic 19.0% |
| Choctaw | 0.1 /100 | #265 | Tragic 19.0% |
| Immigrants | Honduras | 0.1 /100 | #266 | Tragic 19.0% |
| Israelis | 0.1 /100 | #267 | Tragic 19.0% |
Demographics Similar to Nepalese by Unemployment Among Ages 16 to 19 years
In terms of unemployment among ages 16 to 19 years, the demographic groups most similar to Nepalese are Immigrants from Russia (18.2%, a difference of 0.050%), Seminole (18.2%, a difference of 0.050%), Spanish American (18.2%, a difference of 0.14%), Colombian (18.3%, a difference of 0.16%), and Albanian (18.2%, a difference of 0.39%).
| Demographics | Rating | Rank | Unemployment Among Ages 16 to 19 years |
| Immigrants | Serbia | 8.3 /100 | #224 | Tragic 18.1% |
| Immigrants | Chile | 7.5 /100 | #225 | Tragic 18.1% |
| Immigrants | Belgium | 7.3 /100 | #226 | Tragic 18.1% |
| Immigrants | Liberia | 7.1 /100 | #227 | Tragic 18.1% |
| Immigrants | Greece | 7.1 /100 | #228 | Tragic 18.1% |
| Albanians | 5.8 /100 | #229 | Tragic 18.2% |
| Spanish Americans | 4.7 /100 | #230 | Tragic 18.2% |
| Nepalese | 4.2 /100 | #231 | Tragic 18.2% |
| Immigrants | Russia | 4.0 /100 | #232 | Tragic 18.2% |
| Seminole | 4.0 /100 | #233 | Tragic 18.2% |
| Colombians | 3.7 /100 | #234 | Tragic 18.3% |
| French American Indians | 2.9 /100 | #235 | Tragic 18.3% |
| Immigrants | Colombia | 2.7 /100 | #236 | Tragic 18.3% |
| Immigrants | Immigrants | 2.7 /100 | #237 | Tragic 18.3% |
| South Americans | 2.6 /100 | #238 | Tragic 18.3% |