Maltese vs Immigrants from Armenia Householder Income Under 25 years
COMPARE
Maltese
Immigrants from Armenia
Householder Income Under 25 years
Householder Income Under 25 years Comparison
Maltese
Immigrants from Armenia
$53,735
HOUSEHOLDER INCOME UNDER 25 YEARS
97.8/ 100
METRIC RATING
108th/ 347
METRIC RANK
$52,986
HOUSEHOLDER INCOME UNDER 25 YEARS
87.5/ 100
METRIC RATING
142nd/ 347
METRIC RANK
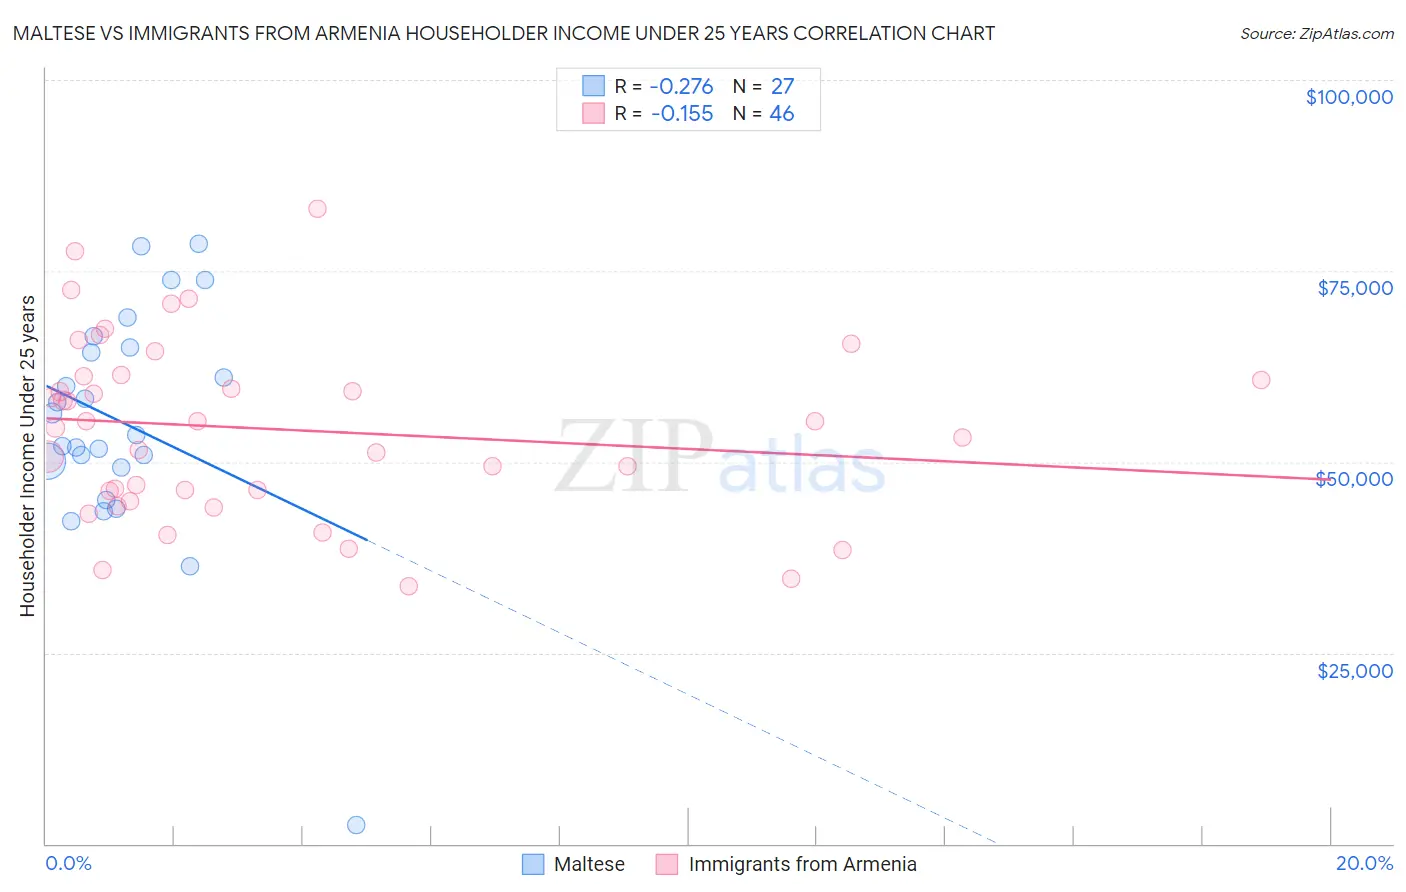
Maltese vs Immigrants from Armenia Householder Income Under 25 years Correlation Chart
The statistical analysis conducted on geographies consisting of 112,948,786 people shows a weak negative correlation between the proportion of Maltese and household income with householder under the age of 25 in the United States with a correlation coefficient (R) of -0.276 and weighted average of $53,735. Similarly, the statistical analysis conducted on geographies consisting of 89,815,578 people shows a poor negative correlation between the proportion of Immigrants from Armenia and household income with householder under the age of 25 in the United States with a correlation coefficient (R) of -0.155 and weighted average of $52,986, a difference of 1.4%.
Householder Income Under 25 years Correlation Summary
| Measurement | Maltese | Immigrants from Armenia |
| Minimum | $2,499 | $33,721 |
| Maximum | $78,500 | $83,068 |
| Range | $76,001 | $49,347 |
| Mean | $55,048 | $54,283 |
| Median | $53,500 | $54,908 |
| Interquartile 25% (IQ1) | $49,238 | $46,216 |
| Interquartile 75% (IQ3) | $65,046 | $61,264 |
| Interquartile Range (IQR) | $15,807 | $15,048 |
| Standard Deviation (Sample) | $15,373 | $11,620 |
| Standard Deviation (Population) | $15,086 | $11,493 |
Similar Demographics by Householder Income Under 25 years
Demographics Similar to Maltese by Householder Income Under 25 years
In terms of householder income under 25 years, the demographic groups most similar to Maltese are Australian ($53,739, a difference of 0.010%), Immigrants from Ecuador ($53,722, a difference of 0.020%), Greek ($53,715, a difference of 0.040%), Immigrants from Colombia ($53,714, a difference of 0.040%), and Immigrants from Oceania ($53,680, a difference of 0.10%).
| Demographics | Rating | Rank | Householder Income Under 25 years |
| South Americans | 98.6 /100 | #101 | Exceptional $53,939 |
| Ecuadorians | 98.5 /100 | #102 | Exceptional $53,911 |
| Ukrainians | 98.3 /100 | #103 | Exceptional $53,843 |
| Ethiopians | 98.2 /100 | #104 | Exceptional $53,818 |
| Immigrants | France | 98.1 /100 | #105 | Exceptional $53,805 |
| Albanians | 98.1 /100 | #106 | Exceptional $53,794 |
| Australians | 97.8 /100 | #107 | Exceptional $53,739 |
| Maltese | 97.8 /100 | #108 | Exceptional $53,735 |
| Immigrants | Ecuador | 97.7 /100 | #109 | Exceptional $53,722 |
| Greeks | 97.7 /100 | #110 | Exceptional $53,715 |
| Immigrants | Colombia | 97.7 /100 | #111 | Exceptional $53,714 |
| Immigrants | Oceania | 97.5 /100 | #112 | Exceptional $53,680 |
| Romanians | 97.2 /100 | #113 | Exceptional $53,632 |
| Immigrants | Sweden | 97.1 /100 | #114 | Exceptional $53,621 |
| Immigrants | Albania | 96.9 /100 | #115 | Exceptional $53,597 |
Demographics Similar to Immigrants from Armenia by Householder Income Under 25 years
In terms of householder income under 25 years, the demographic groups most similar to Immigrants from Armenia are Swedish ($52,986, a difference of 0.0%), South American Indian ($52,979, a difference of 0.010%), Immigrants from Western Europe ($52,957, a difference of 0.050%), Danish ($53,041, a difference of 0.10%), and Hawaiian ($53,078, a difference of 0.17%).
| Demographics | Rating | Rank | Householder Income Under 25 years |
| Chileans | 91.9 /100 | #135 | Exceptional $53,185 |
| Armenians | 91.8 /100 | #136 | Exceptional $53,179 |
| Immigrants | Barbados | 91.5 /100 | #137 | Exceptional $53,163 |
| Norwegians | 90.8 /100 | #138 | Exceptional $53,127 |
| Costa Ricans | 90.4 /100 | #139 | Exceptional $53,106 |
| Hawaiians | 89.8 /100 | #140 | Excellent $53,078 |
| Danes | 88.9 /100 | #141 | Excellent $53,041 |
| Immigrants | Armenia | 87.5 /100 | #142 | Excellent $52,986 |
| Swedes | 87.5 /100 | #143 | Excellent $52,986 |
| South American Indians | 87.3 /100 | #144 | Excellent $52,979 |
| Immigrants | Western Europe | 86.7 /100 | #145 | Excellent $52,957 |
| Immigrants | Hungary | 81.6 /100 | #146 | Excellent $52,798 |
| Latvians | 81.0 /100 | #147 | Excellent $52,783 |
| French Canadians | 76.5 /100 | #148 | Good $52,672 |
| Scandinavians | 75.7 /100 | #149 | Good $52,654 |