Bolivian vs Immigrants from Armenia Householder Income Under 25 years
COMPARE
Bolivian
Immigrants from Armenia
Householder Income Under 25 years
Householder Income Under 25 years Comparison
Bolivians
Immigrants from Armenia
$58,506
HOUSEHOLDER INCOME UNDER 25 YEARS
100.0/ 100
METRIC RATING
7th/ 347
METRIC RANK
$52,986
HOUSEHOLDER INCOME UNDER 25 YEARS
87.5/ 100
METRIC RATING
142nd/ 347
METRIC RANK
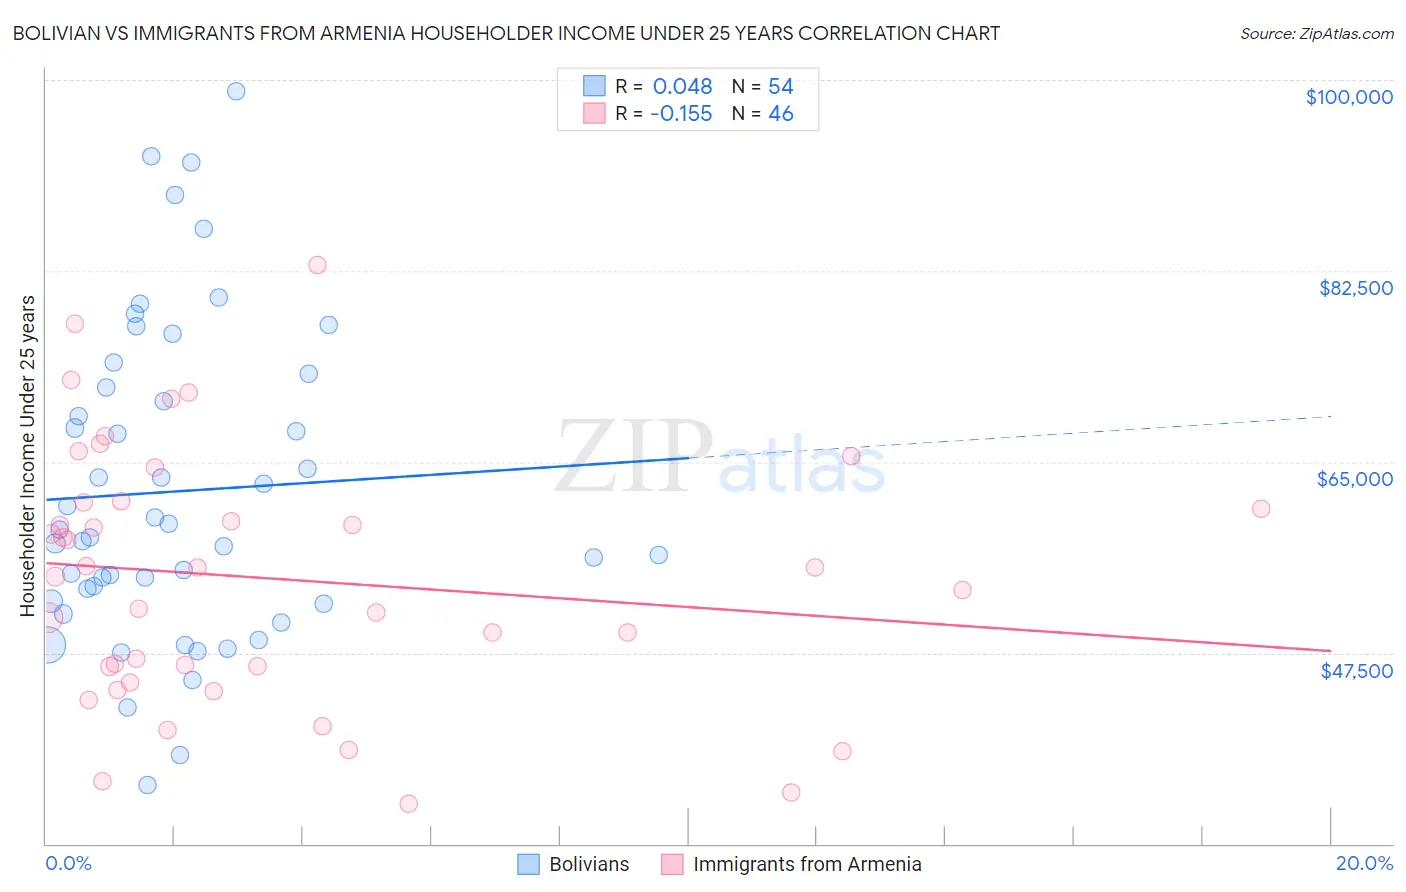
Bolivian vs Immigrants from Armenia Householder Income Under 25 years Correlation Chart
The statistical analysis conducted on geographies consisting of 166,062,269 people shows no correlation between the proportion of Bolivians and household income with householder under the age of 25 in the United States with a correlation coefficient (R) of 0.048 and weighted average of $58,506. Similarly, the statistical analysis conducted on geographies consisting of 89,815,578 people shows a poor negative correlation between the proportion of Immigrants from Armenia and household income with householder under the age of 25 in the United States with a correlation coefficient (R) of -0.155 and weighted average of $52,986, a difference of 10.4%.
Householder Income Under 25 years Correlation Summary
| Measurement | Bolivian | Immigrants from Armenia |
| Minimum | $35,342 | $33,721 |
| Maximum | $98,935 | $83,068 |
| Range | $63,593 | $49,347 |
| Mean | $62,297 | $54,283 |
| Median | $58,422 | $54,908 |
| Interquartile 25% (IQ1) | $52,223 | $46,216 |
| Interquartile 75% (IQ3) | $71,837 | $61,264 |
| Interquartile Range (IQR) | $19,614 | $15,048 |
| Standard Deviation (Sample) | $14,374 | $11,620 |
| Standard Deviation (Population) | $14,241 | $11,493 |
Similar Demographics by Householder Income Under 25 years
Demographics Similar to Bolivians by Householder Income Under 25 years
In terms of householder income under 25 years, the demographic groups most similar to Bolivians are Indian (Asian) ($58,239, a difference of 0.46%), Chinese ($58,162, a difference of 0.59%), Afghan ($58,019, a difference of 0.84%), Immigrants from China ($57,931, a difference of 0.99%), and Immigrants from Philippines ($57,930, a difference of 1.0%).
| Demographics | Rating | Rank | Householder Income Under 25 years |
| Assyrians/Chaldeans/Syriacs | 100.0 /100 | #1 | Exceptional $65,329 |
| Immigrants | Hong Kong | 100.0 /100 | #2 | Exceptional $62,083 |
| Immigrants | India | 100.0 /100 | #3 | Exceptional $59,914 |
| Immigrants | Taiwan | 100.0 /100 | #4 | Exceptional $59,424 |
| Immigrants | Bolivia | 100.0 /100 | #5 | Exceptional $59,389 |
| Thais | 100.0 /100 | #6 | Exceptional $59,187 |
| Bolivians | 100.0 /100 | #7 | Exceptional $58,506 |
| Indians (Asian) | 100.0 /100 | #8 | Exceptional $58,239 |
| Chinese | 100.0 /100 | #9 | Exceptional $58,162 |
| Afghans | 100.0 /100 | #10 | Exceptional $58,019 |
| Immigrants | China | 100.0 /100 | #11 | Exceptional $57,931 |
| Immigrants | Philippines | 100.0 /100 | #12 | Exceptional $57,930 |
| Immigrants | South Central Asia | 100.0 /100 | #13 | Exceptional $57,818 |
| Filipinos | 100.0 /100 | #14 | Exceptional $57,740 |
| Koreans | 100.0 /100 | #15 | Exceptional $57,730 |
Demographics Similar to Immigrants from Armenia by Householder Income Under 25 years
In terms of householder income under 25 years, the demographic groups most similar to Immigrants from Armenia are Swedish ($52,986, a difference of 0.0%), South American Indian ($52,979, a difference of 0.010%), Immigrants from Western Europe ($52,957, a difference of 0.050%), Danish ($53,041, a difference of 0.10%), and Hawaiian ($53,078, a difference of 0.17%).
| Demographics | Rating | Rank | Householder Income Under 25 years |
| Chileans | 91.9 /100 | #135 | Exceptional $53,185 |
| Armenians | 91.8 /100 | #136 | Exceptional $53,179 |
| Immigrants | Barbados | 91.5 /100 | #137 | Exceptional $53,163 |
| Norwegians | 90.8 /100 | #138 | Exceptional $53,127 |
| Costa Ricans | 90.4 /100 | #139 | Exceptional $53,106 |
| Hawaiians | 89.8 /100 | #140 | Excellent $53,078 |
| Danes | 88.9 /100 | #141 | Excellent $53,041 |
| Immigrants | Armenia | 87.5 /100 | #142 | Excellent $52,986 |
| Swedes | 87.5 /100 | #143 | Excellent $52,986 |
| South American Indians | 87.3 /100 | #144 | Excellent $52,979 |
| Immigrants | Western Europe | 86.7 /100 | #145 | Excellent $52,957 |
| Immigrants | Hungary | 81.6 /100 | #146 | Excellent $52,798 |
| Latvians | 81.0 /100 | #147 | Excellent $52,783 |
| French Canadians | 76.5 /100 | #148 | Good $52,672 |
| Scandinavians | 75.7 /100 | #149 | Good $52,654 |