Malaysian vs Uruguayan Householder Income Over 65 years

COMPARE

Malaysian
Race
Ancestry
AfghanAfricanAlaska NativeAlaskan AthabascanAlbanianAleutAlsatianAmericanApacheArabArapahoArgentineanArmenianAssyrian/Chaldean/SyriacAustralianAustrianBahamianBangladeshiBarbadianBasqueBelgianBelizeanBermudanBhutaneseBlackfeetBolivianBrazilianBritishBritish West IndianBulgarianBurmeseCajunCambodianCanadianCape VerdeanCarpatho RusynCelticCentral AmericanCentral American IndianCherokeeCheyenneChickasawChileanChineseChippewaChoctawColombianColvilleComancheCosta RicanCreeCreekCroatianCrowCubanCypriotCzechCzechoslovakianDanishDelawareDominicanDutchDutch West IndianEastern EuropeanEcuadorianEgyptianEnglishEstonianEthiopianEuropeanFijianFilipinoFinnishFrenchFrench American IndianFrench CanadianGermanGerman RussianGhanaianGreekGuamanian/ChamorroGuatemalanGuyaneseHaitianHmongHonduranHopiHoumaHungarianIcelanderIndian (Asian)IndonesianInupiatIranianIraqiIrishIroquoisIsraeliItalianJamaicanJapaneseJordanianKenyanKiowaKoreanLaotianLatvianLebaneseLiberianLithuanianLumbeeLuxembourgerMacedonianMalaysianMalteseMarshalleseMenomineeMexicanMexican American IndianMongolianMoroccanNative HawaiianNavajoNepaleseNew ZealanderNicaraguanNigerianNorthern EuropeanNorwegianOkinawanOsageOttawaPaiutePakistaniPalestinianPanamanianParaguayanPennsylvania GermanPeruvianPimaPolishPortuguesePotawatomiPuebloPuerto RicanPuget Sound SalishRomanianRussianSalvadoranSamoanScandinavianScotch-IrishScottishSeminoleSenegaleseSerbianShoshoneSierra LeoneanSiouxSlavicSlovakSloveneSomaliSouth AfricanSouth AmericanSouth American IndianSoviet UnionSpaniardSpanishSpanish AmericanSpanish American IndianSri LankanSubsaharan AfricanSudaneseSwedishSwissSyrianTaiwaneseThaiTlingit-HaidaTohono O'OdhamTonganTrinidadian and TobagonianTsimshianTurkishU.S. Virgin IslanderUgandanUkrainianUteVenezuelanVietnameseWelshWest IndianYakamaYaquiYugoslavianYumanYup'ikZimbabwean
Immigration
NonimmigrantsImmigrantsAfghanistanAfricaAlbaniaArgentinaArmeniaAsiaAustraliaAustriaBahamasBangladeshBarbadosBelarusBelgiumBelizeBoliviaBosnia and HerzegovinaBrazilBulgariaBurma/MyanmarCabo VerdeCambodiaCameroonCanadaCaribbeanCentral AmericaChileChinaColombiaCongoCosta RicaCroatiaCubaCzechoslovakiaDenmarkDominicaDominican RepublicEastern AfricaEastern AsiaEastern EuropeEcuadorEgyptEl SalvadorEnglandEritreaEthiopiaEuropeFijiFranceGermanyGhanaGreeceGrenadaGuatemalaGuyanaHaitiHondurasHong KongHungaryIndiaIndonesiaIranIraqIrelandIsraelItalyJamaicaJapanJordanKazakhstanKenyaKoreaKuwaitLaosLatin AmericaLatviaLebanonLiberiaLithuaniaMalaysiaMexicoMicronesiaMiddle AfricaMoldovaMoroccoNepalNetherlandsNicaraguaNigeriaNorth AmericaNorth MacedoniaNorthern AfricaNorthern EuropeNorwayOceaniaPakistanPanamaPeruPhilippinesPolandPortugalRomaniaRussiaSaudi ArabiaScotlandSenegalSerbiaSierra LeoneSingaporeSomaliaSouth AfricaSouth AmericaSouth Central AsiaSouth Eastern AsiaSouthern EuropeSpainSri LankaSt. Vincent and the GrenadinesSudanSwedenSwitzerlandSyriaTaiwanThailandTrinidad and TobagoTurkeyUgandaUkraineUruguayUzbekistanVenezuelaVietnamWest IndiesWestern AfricaWestern AsiaWestern EuropeYemenZaireZimbabweAzores
Uruguayan
Race
Ancestry
AfghanAfricanAlaska NativeAlaskan AthabascanAlbanianAleutAlsatianAmericanApacheArabArapahoArgentineanArmenianAssyrian/Chaldean/SyriacAustralianAustrianBahamianBangladeshiBarbadianBasqueBelgianBelizeanBermudanBhutaneseBlackfeetBolivianBrazilianBritishBritish West IndianBulgarianBurmeseCajunCambodianCanadianCape VerdeanCarpatho RusynCelticCentral AmericanCentral American IndianCherokeeCheyenneChickasawChileanChineseChippewaChoctawColombianColvilleComancheCosta RicanCreeCreekCroatianCrowCubanCypriotCzechCzechoslovakianDanishDelawareDominicanDutchDutch West IndianEastern EuropeanEcuadorianEgyptianEnglishEstonianEthiopianEuropeanFijianFilipinoFinnishFrenchFrench American IndianFrench CanadianGermanGerman RussianGhanaianGreekGuamanian/ChamorroGuatemalanGuyaneseHaitianHmongHonduranHopiHoumaHungarianIcelanderIndian (Asian)IndonesianInupiatIranianIraqiIrishIroquoisIsraeliItalianJamaicanJapaneseJordanianKenyanKiowaKoreanLaotianLatvianLebaneseLiberianLithuanianLumbeeLuxembourgerMacedonianMalteseMarshalleseMenomineeMexicanMexican American IndianMongolianMoroccanNative HawaiianNavajoNepaleseNew ZealanderNicaraguanNigerianNorthern EuropeanNorwegianOkinawanOsageOttawaPaiutePakistaniPalestinianPanamanianParaguayanPennsylvania GermanPeruvianPimaPolishPortuguesePotawatomiPuebloPuerto RicanPuget Sound SalishRomanianRussianSalvadoranSamoanScandinavianScotch-IrishScottishSeminoleSenegaleseSerbianShoshoneSierra LeoneanSiouxSlavicSlovakSloveneSomaliSouth AfricanSouth AmericanSouth American IndianSoviet UnionSpaniardSpanishSpanish AmericanSpanish American IndianSri LankanSubsaharan AfricanSudaneseSwedishSwissSyrianTaiwaneseThaiTlingit-HaidaTohono O'OdhamTonganTrinidadian and TobagonianTsimshianTurkishU.S. Virgin IslanderUgandanUkrainianUruguayanUteVenezuelanVietnameseWelshWest IndianYakamaYaquiYugoslavianYumanYup'ikZimbabwean
Immigration
NonimmigrantsImmigrantsAfghanistanAfricaAlbaniaArgentinaArmeniaAsiaAustraliaAustriaBahamasBangladeshBarbadosBelarusBelgiumBelizeBoliviaBosnia and HerzegovinaBrazilBulgariaBurma/MyanmarCabo VerdeCambodiaCameroonCanadaCaribbeanCentral AmericaChileChinaColombiaCongoCosta RicaCroatiaCubaCzechoslovakiaDenmarkDominicaDominican RepublicEastern AfricaEastern AsiaEastern EuropeEcuadorEgyptEl SalvadorEnglandEritreaEthiopiaEuropeFijiFranceGermanyGhanaGreeceGrenadaGuatemalaGuyanaHaitiHondurasHong KongHungaryIndiaIndonesiaIranIraqIrelandIsraelItalyJamaicaJapanJordanKazakhstanKenyaKoreaKuwaitLaosLatin AmericaLatviaLebanonLiberiaLithuaniaMalaysiaMexicoMicronesiaMiddle AfricaMoldovaMoroccoNepalNetherlandsNicaraguaNigeriaNorth AmericaNorth MacedoniaNorthern AfricaNorthern EuropeNorwayOceaniaPakistanPanamaPeruPhilippinesPolandPortugalRomaniaRussiaSaudi ArabiaScotlandSenegalSerbiaSierra LeoneSingaporeSomaliaSouth AfricaSouth AmericaSouth Central AsiaSouth Eastern AsiaSouthern EuropeSpainSri LankaSt. Vincent and the GrenadinesSudanSwedenSwitzerlandSyriaTaiwanThailandTrinidad and TobagoTurkeyUgandaUkraineUruguayUzbekistanVenezuelaVietnamWest IndiesWestern AfricaWestern AsiaWestern EuropeYemenZaireZimbabweAzores
Householder Income Over 65 years
Income
Poverty
Unemployment
Labor Participation
Family Structure
Vehicle Availability
Education Level
Disability

Householder Income Over 65 years Comparison

Malaysians

Uruguayans

Tragic
Poor
$58,244
HOUSEHOLDER INCOME OVER 65 YEARS
5.5/ 100
METRIC RATING
219th/ 347
METRIC RANK
$59,090
HOUSEHOLDER INCOME OVER 65 YEARS
12.3/ 100
METRIC RATING
208th/ 347
METRIC RANK

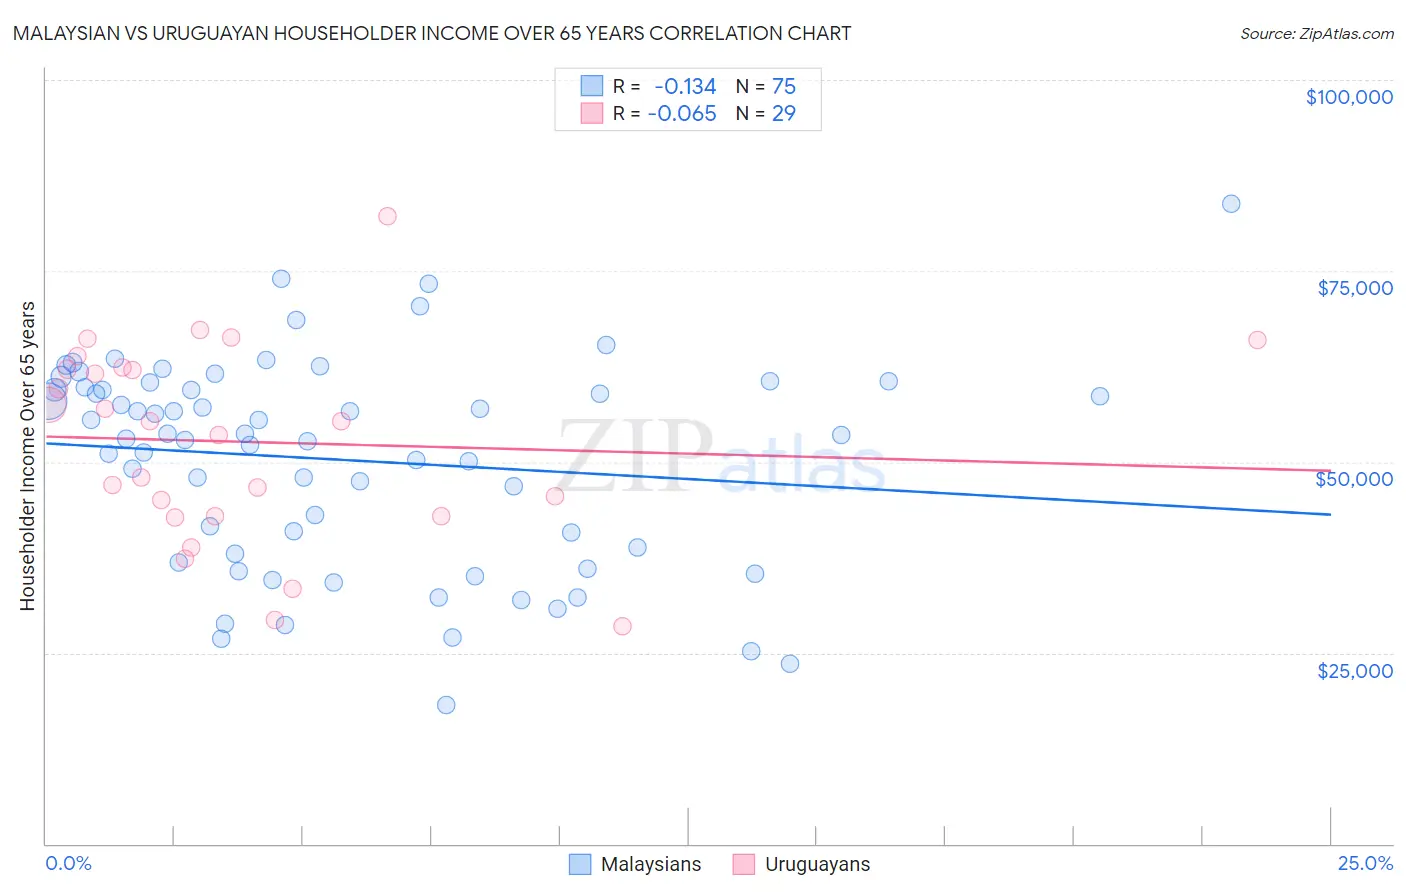
Malaysian vs Uruguayan Householder Income Over 65 years Correlation Chart

The statistical analysis conducted on geographies consisting of 225,600,084 people shows a poor negative correlation between the proportion of Malaysians and household income with householder over the age of 65 in the United States with a correlation coefficient (R) of -0.134 and weighted average of $58,244. Similarly, the statistical analysis conducted on geographies consisting of 144,707,932 people shows a slight negative correlation between the proportion of Uruguayans and household income with householder over the age of 65 in the United States with a correlation coefficient (R) of -0.065 and weighted average of $59,090, a difference of 1.5%.
Malaysian vs Uruguayan Householder Income Over 65 years

Householder Income Over 65 years Correlation Summary

MeasurementMalaysianUruguayan
Minimum$18,125$28,542
Maximum$83,750$82,100
Range$65,625$53,558
Mean$50,258$52,609
Median$53,597$55,347
Interquartile 25% (IQ1)$37,943$42,887
Interquartile 75% (IQ3)$59,785$62,271
Interquartile Range (IQR)$21,842$19,384
Standard Deviation (Sample)$13,663$12,851
Standard Deviation (Population)$13,572$12,627

Demographics Similar to Malaysians and Uruguayans by Householder Income Over 65 years

In terms of householder income over 65 years, the demographic groups most similar to Malaysians are Yugoslavian ($58,243, a difference of 0.0%), Immigrants from El Salvador ($58,226, a difference of 0.030%), Panamanian ($58,266, a difference of 0.040%), Delaware ($58,214, a difference of 0.050%), and Sudanese ($58,281, a difference of 0.060%). Similarly, the demographic groups most similar to Uruguayans are Salvadoran ($59,141, a difference of 0.090%), Slovak ($59,039, a difference of 0.090%), Immigrants from South America ($59,151, a difference of 0.10%), Nigerian ($58,992, a difference of 0.17%), and Immigrants from Nigeria ($58,942, a difference of 0.25%).
DemographicsRating | RankHouseholder Income Over 65 years
Scotch-Irish
16.9
/100
|
#203
Poor
$59,447
Arapaho
16.0
/100
|
#204
Poor
$59,383
Immigrants | Sudan
14.2
/100
|
#205
Poor
$59,248
Immigrants | South America
13.0
/100
|
#206
Poor
$59,151
Salvadorans
12.9
/100
|
#207
Poor
$59,141
Uruguayans
12.3
/100
|
#208
Poor
$59,090
Slovaks
11.7
/100
|
#209
Poor
$59,039
Nigerians
11.2
/100
|
#210
Poor
$58,992
Immigrants | Nigeria
10.7
/100
|
#211
Poor
$58,942
Colombians
9.8
/100
|
#212
Tragic
$58,851
Whites/Caucasians
9.8
/100
|
#213
Tragic
$58,847
Nepalese
9.0
/100
|
#214
Tragic
$58,761
Immigrants | Ghana
7.9
/100
|
#215
Tragic
$58,624
Immigrants | Middle Africa
6.2
/100
|
#216
Tragic
$58,375
Sudanese
5.7
/100
|
#217
Tragic
$58,281
Panamanians
5.6
/100
|
#218
Tragic
$58,266
Malaysians
5.5
/100
|
#219
Tragic
$58,244
Yugoslavians
5.5
/100
|
#220
Tragic
$58,243
Immigrants | El Salvador
5.4
/100
|
#221
Tragic
$58,226
Delaware
5.3
/100
|
#222
Tragic
$58,214
Tsimshian
5.2
/100
|
#223
Tragic
$58,202