Immigrants from Liberia vs Uruguayan Householder Income Over 65 years
COMPARE
Immigrants from Liberia
Uruguayan
Householder Income Over 65 years
Householder Income Over 65 years Comparison
Immigrants from Liberia
Uruguayans
$53,967
HOUSEHOLDER INCOME OVER 65 YEARS
0.1/ 100
METRIC RATING
283rd/ 347
METRIC RANK
$59,090
HOUSEHOLDER INCOME OVER 65 YEARS
12.3/ 100
METRIC RATING
208th/ 347
METRIC RANK
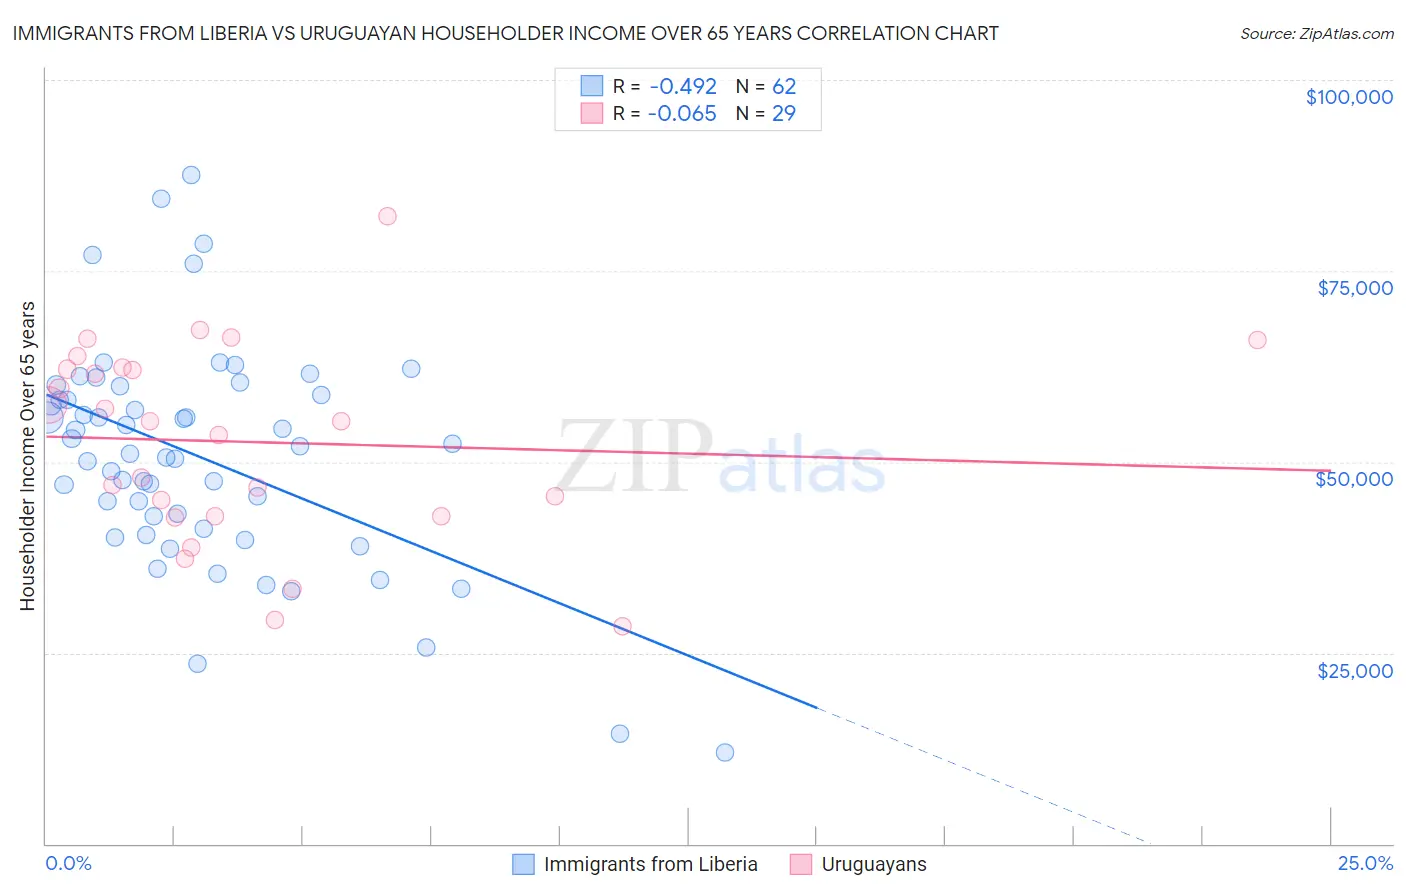
Immigrants from Liberia vs Uruguayan Householder Income Over 65 years Correlation Chart
The statistical analysis conducted on geographies consisting of 135,019,042 people shows a moderate negative correlation between the proportion of Immigrants from Liberia and household income with householder over the age of 65 in the United States with a correlation coefficient (R) of -0.492 and weighted average of $53,967. Similarly, the statistical analysis conducted on geographies consisting of 144,707,932 people shows a slight negative correlation between the proportion of Uruguayans and household income with householder over the age of 65 in the United States with a correlation coefficient (R) of -0.065 and weighted average of $59,090, a difference of 9.5%.
Householder Income Over 65 years Correlation Summary
| Measurement | Immigrants from Liberia | Uruguayan |
| Minimum | $12,021 | $28,542 |
| Maximum | $87,542 | $82,100 |
| Range | $75,521 | $53,558 |
| Mean | $50,612 | $52,609 |
| Median | $51,560 | $55,347 |
| Interquartile 25% (IQ1) | $41,319 | $42,887 |
| Interquartile 75% (IQ3) | $58,797 | $62,271 |
| Interquartile Range (IQR) | $17,478 | $19,384 |
| Standard Deviation (Sample) | $14,601 | $12,851 |
| Standard Deviation (Population) | $14,483 | $12,627 |
Similar Demographics by Householder Income Over 65 years
Demographics Similar to Immigrants from Liberia by Householder Income Over 65 years
In terms of householder income over 65 years, the demographic groups most similar to Immigrants from Liberia are Immigrants from Armenia ($53,974, a difference of 0.010%), Immigrants from Guatemala ($53,950, a difference of 0.030%), Somali ($54,004, a difference of 0.070%), Immigrants from Jamaica ($54,027, a difference of 0.11%), and Immigrants from Ecuador ($54,030, a difference of 0.12%).
| Demographics | Rating | Rank | Householder Income Over 65 years |
| Cree | 0.1 /100 | #276 | Tragic $54,129 |
| Cheyenne | 0.1 /100 | #277 | Tragic $54,096 |
| Immigrants | Ecuador | 0.1 /100 | #278 | Tragic $54,030 |
| Blackfeet | 0.1 /100 | #279 | Tragic $54,029 |
| Immigrants | Jamaica | 0.1 /100 | #280 | Tragic $54,027 |
| Somalis | 0.1 /100 | #281 | Tragic $54,004 |
| Immigrants | Armenia | 0.1 /100 | #282 | Tragic $53,974 |
| Immigrants | Liberia | 0.1 /100 | #283 | Tragic $53,967 |
| Immigrants | Guatemala | 0.1 /100 | #284 | Tragic $53,950 |
| Mexicans | 0.1 /100 | #285 | Tragic $53,897 |
| Chippewa | 0.1 /100 | #286 | Tragic $53,847 |
| Immigrants | Barbados | 0.1 /100 | #287 | Tragic $53,766 |
| Paiute | 0.1 /100 | #288 | Tragic $53,762 |
| Iroquois | 0.1 /100 | #289 | Tragic $53,737 |
| Chickasaw | 0.1 /100 | #290 | Tragic $53,732 |
Demographics Similar to Uruguayans by Householder Income Over 65 years
In terms of householder income over 65 years, the demographic groups most similar to Uruguayans are Salvadoran ($59,141, a difference of 0.090%), Slovak ($59,039, a difference of 0.090%), Immigrants from South America ($59,151, a difference of 0.10%), Nigerian ($58,992, a difference of 0.17%), and Immigrants from Nigeria ($58,942, a difference of 0.25%).
| Demographics | Rating | Rank | Householder Income Over 65 years |
| Dutch | 18.3 /100 | #201 | Poor $59,539 |
| Finns | 18.2 /100 | #202 | Poor $59,535 |
| Scotch-Irish | 16.9 /100 | #203 | Poor $59,447 |
| Arapaho | 16.0 /100 | #204 | Poor $59,383 |
| Immigrants | Sudan | 14.2 /100 | #205 | Poor $59,248 |
| Immigrants | South America | 13.0 /100 | #206 | Poor $59,151 |
| Salvadorans | 12.9 /100 | #207 | Poor $59,141 |
| Uruguayans | 12.3 /100 | #208 | Poor $59,090 |
| Slovaks | 11.7 /100 | #209 | Poor $59,039 |
| Nigerians | 11.2 /100 | #210 | Poor $58,992 |
| Immigrants | Nigeria | 10.7 /100 | #211 | Poor $58,942 |
| Colombians | 9.8 /100 | #212 | Tragic $58,851 |
| Whites/Caucasians | 9.8 /100 | #213 | Tragic $58,847 |
| Nepalese | 9.0 /100 | #214 | Tragic $58,761 |
| Immigrants | Ghana | 7.9 /100 | #215 | Tragic $58,624 |