Macedonian vs Immigrants from North Macedonia Median Male Earnings
COMPARE
Macedonian
Immigrants from North Macedonia
Median Male Earnings
Median Male Earnings Comparison
Macedonians
Immigrants from North Macedonia
$59,522
MEDIAN MALE EARNINGS
99.3/ 100
METRIC RATING
87th/ 347
METRIC RANK
$59,189
MEDIAN MALE EARNINGS
99.0/ 100
METRIC RATING
94th/ 347
METRIC RANK
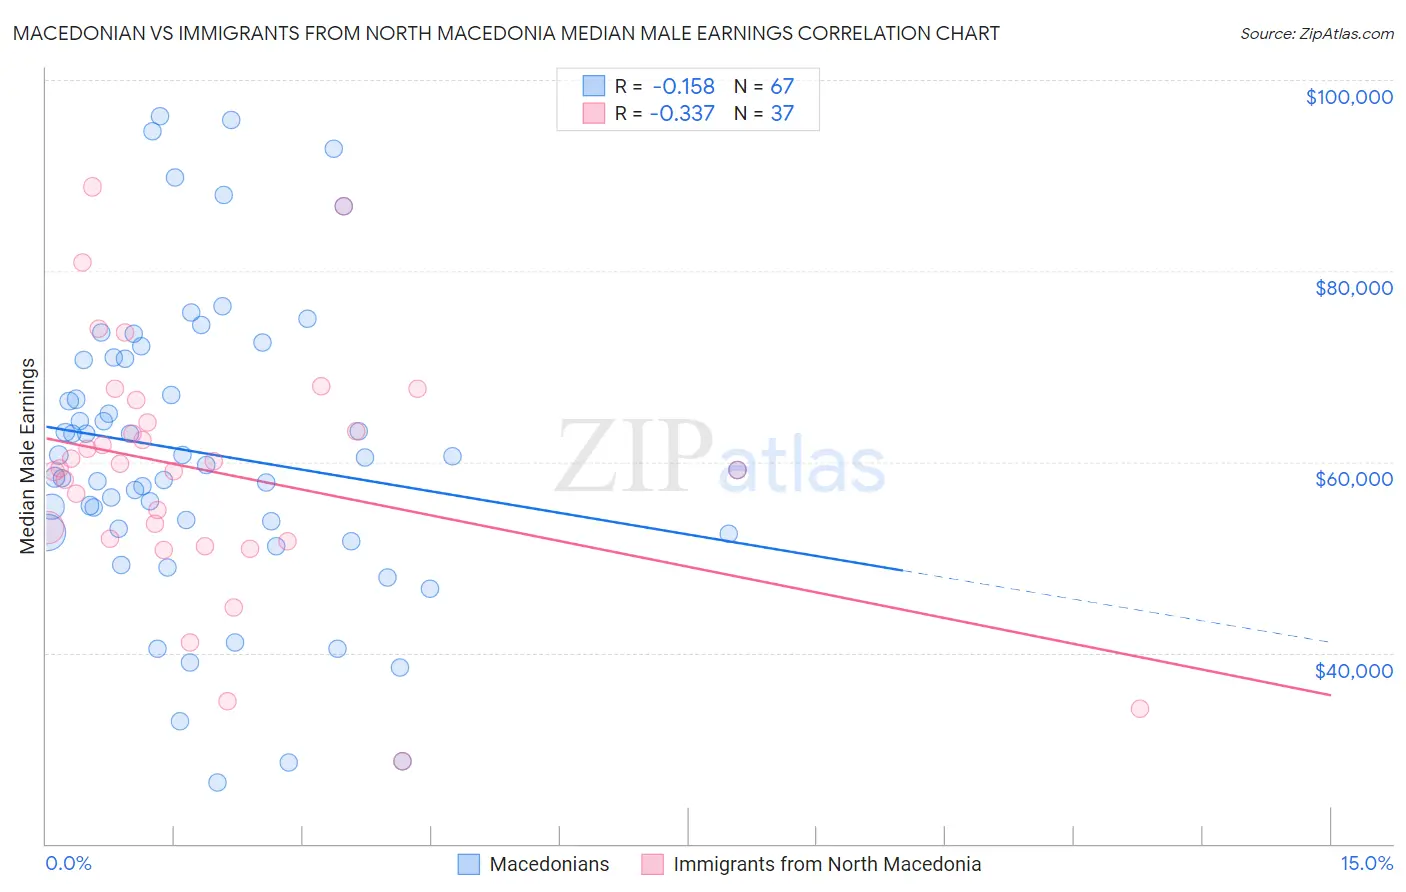
Macedonian vs Immigrants from North Macedonia Median Male Earnings Correlation Chart
The statistical analysis conducted on geographies consisting of 132,576,101 people shows a poor negative correlation between the proportion of Macedonians and median male earnings in the United States with a correlation coefficient (R) of -0.158 and weighted average of $59,522. Similarly, the statistical analysis conducted on geographies consisting of 74,299,298 people shows a mild negative correlation between the proportion of Immigrants from North Macedonia and median male earnings in the United States with a correlation coefficient (R) of -0.337 and weighted average of $59,189, a difference of 0.56%.
Median Male Earnings Correlation Summary
| Measurement | Macedonian | Immigrants from North Macedonia |
| Minimum | $26,375 | $28,661 |
| Maximum | $96,230 | $88,807 |
| Range | $69,855 | $60,146 |
| Mean | $60,888 | $58,993 |
| Median | $59,610 | $59,337 |
| Interquartile 25% (IQ1) | $52,559 | $51,864 |
| Interquartile 75% (IQ3) | $70,744 | $65,296 |
| Interquartile Range (IQR) | $18,185 | $13,432 |
| Standard Deviation (Sample) | $15,733 | $12,888 |
| Standard Deviation (Population) | $15,615 | $12,712 |
Demographics Similar to Macedonians and Immigrants from North Macedonia by Median Male Earnings
In terms of median male earnings, the demographic groups most similar to Macedonians are Immigrants from England ($59,527, a difference of 0.010%), Afghan ($59,554, a difference of 0.050%), Italian ($59,551, a difference of 0.050%), Immigrants from Argentina ($59,491, a difference of 0.050%), and Immigrants from Moldova ($59,417, a difference of 0.18%). Similarly, the demographic groups most similar to Immigrants from North Macedonia are Immigrants from Southern Europe ($59,217, a difference of 0.050%), Immigrants from Kazakhstan ($59,278, a difference of 0.15%), Laotian ($59,351, a difference of 0.27%), Austrian ($59,359, a difference of 0.29%), and Immigrants from Moldova ($59,417, a difference of 0.39%).
| Demographics | Rating | Rank | Median Male Earnings |
| Immigrants | Hungary | 99.5 /100 | #80 | Exceptional $59,806 |
| Ukrainians | 99.4 /100 | #81 | Exceptional $59,728 |
| Croatians | 99.4 /100 | #82 | Exceptional $59,715 |
| Immigrants | Italy | 99.4 /100 | #83 | Exceptional $59,691 |
| Afghans | 99.3 /100 | #84 | Exceptional $59,554 |
| Italians | 99.3 /100 | #85 | Exceptional $59,551 |
| Immigrants | England | 99.3 /100 | #86 | Exceptional $59,527 |
| Macedonians | 99.3 /100 | #87 | Exceptional $59,522 |
| Immigrants | Argentina | 99.3 /100 | #88 | Exceptional $59,491 |
| Immigrants | Moldova | 99.2 /100 | #89 | Exceptional $59,417 |
| Austrians | 99.2 /100 | #90 | Exceptional $59,359 |
| Laotians | 99.2 /100 | #91 | Exceptional $59,351 |
| Immigrants | Kazakhstan | 99.1 /100 | #92 | Exceptional $59,278 |
| Immigrants | Southern Europe | 99.0 /100 | #93 | Exceptional $59,217 |
| Immigrants | North Macedonia | 99.0 /100 | #94 | Exceptional $59,189 |
| Immigrants | Lebanon | 98.6 /100 | #95 | Exceptional $58,835 |
| Albanians | 98.4 /100 | #96 | Exceptional $58,680 |
| Northern Europeans | 98.2 /100 | #97 | Exceptional $58,588 |
| Jordanians | 98.1 /100 | #98 | Exceptional $58,500 |
| Immigrants | Poland | 98.0 /100 | #99 | Exceptional $58,452 |
| Assyrians/Chaldeans/Syriacs | 97.9 /100 | #100 | Exceptional $58,437 |